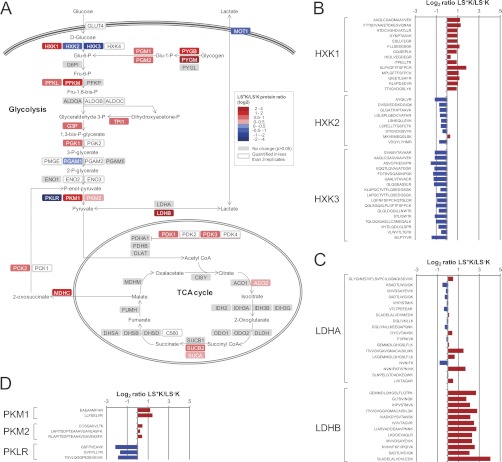
Fig. 4.
A, Differential expression of proteins involved in glycolysis and TCA cycle. A pathway map was built based on Metacore GeneGO pathway maps of glycolysis and glyconeogenesis. Proteins higher expressed in LS+K cells are shown in red and proteins higher expressed in LS−K cells are shown in blue. Quantified but not significantly differentially expressed proteins (p > 0.05) are shown in gray. B, Peptide ratios for unique peptides of isoforms of hexokinase. Average values from two or three replicates are shown. C, Peptide ratios for unique peptides of subunits of lactate dehydrogenase. Average values from two or three replicates are shown. D, Peptide ratios for unique peptides of isoforms of pyruvate kinase. Average values from two or three replicates are shown.

