Fig. 1.
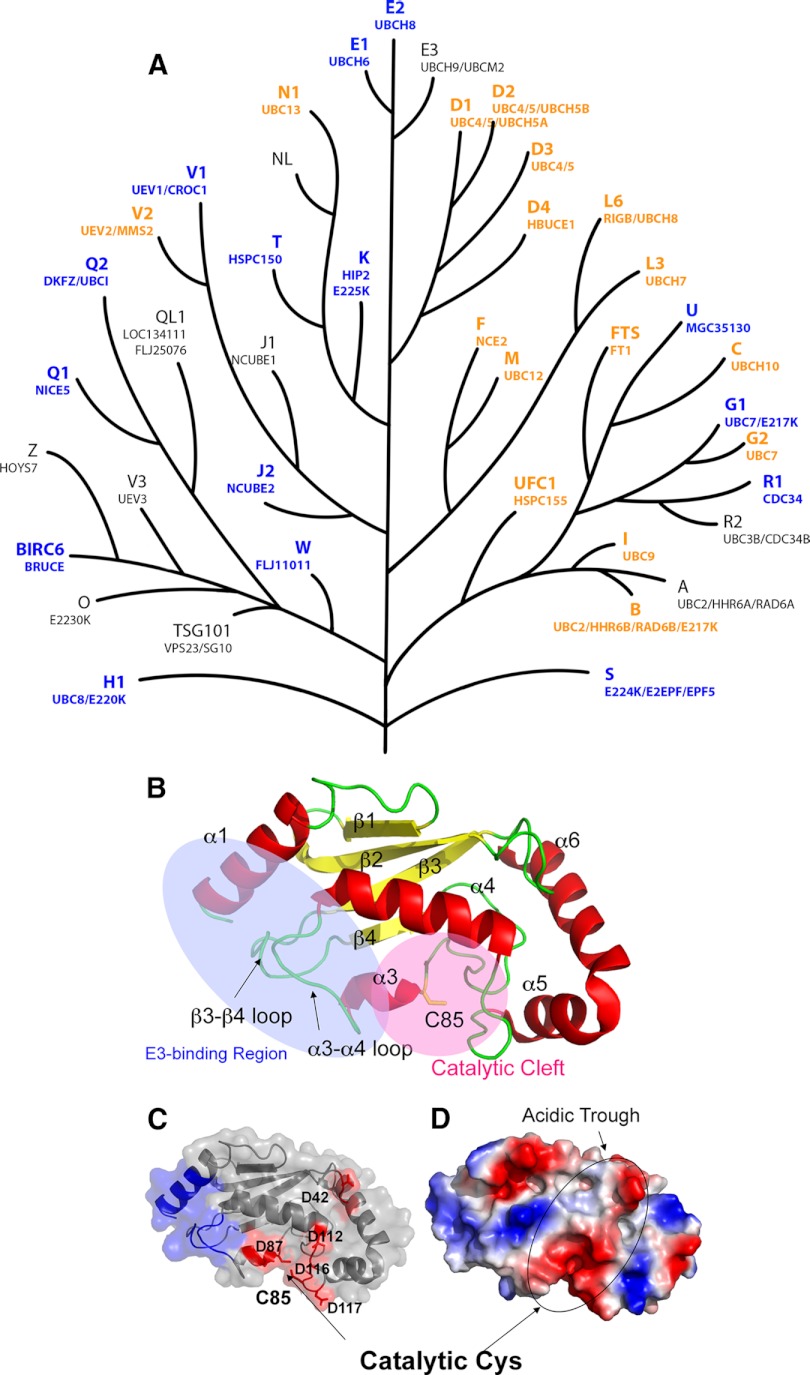
The UBC domain. A, Dendrogram of human UBC domains, depicting putative evolutionary relationships. A phylogenetic tree was generated from a cladogram derived from a ClustalW2 alignment of the minimal UBC fold. Nodal distances and relationships have been modified for clarity. NCBI gene nomenclature is shown above in larger font, and aliases below. Protein structures solved in this study are colored blue, and previously published structures are depicted in orange. B, Ribbon diagram of UBE2D1 (PDBID: 2C4P). Helices are labeled as α1-α6, and strands as β1-β4. Helix α2 is not observed in UBE2D1, but contained in the structures of UBE2Q1 (2QGX) and UBE2Q2 (1ZUO), and is located between β2 and β3. The E3 ligase binding region (blue) and the catalytic cleft (pink) encompassing Cys85 at the active site are also indicated. C, A surface and ribbon representation of UBE2D1, with the E3-binding region colored in blue. Acidic residues on the negatively charged surface are also indicated. D, An electrostatic surface representation of UBE2D1 in the same orientation. Locations of the acidic trough and catalytic Cys residue are indicated.

