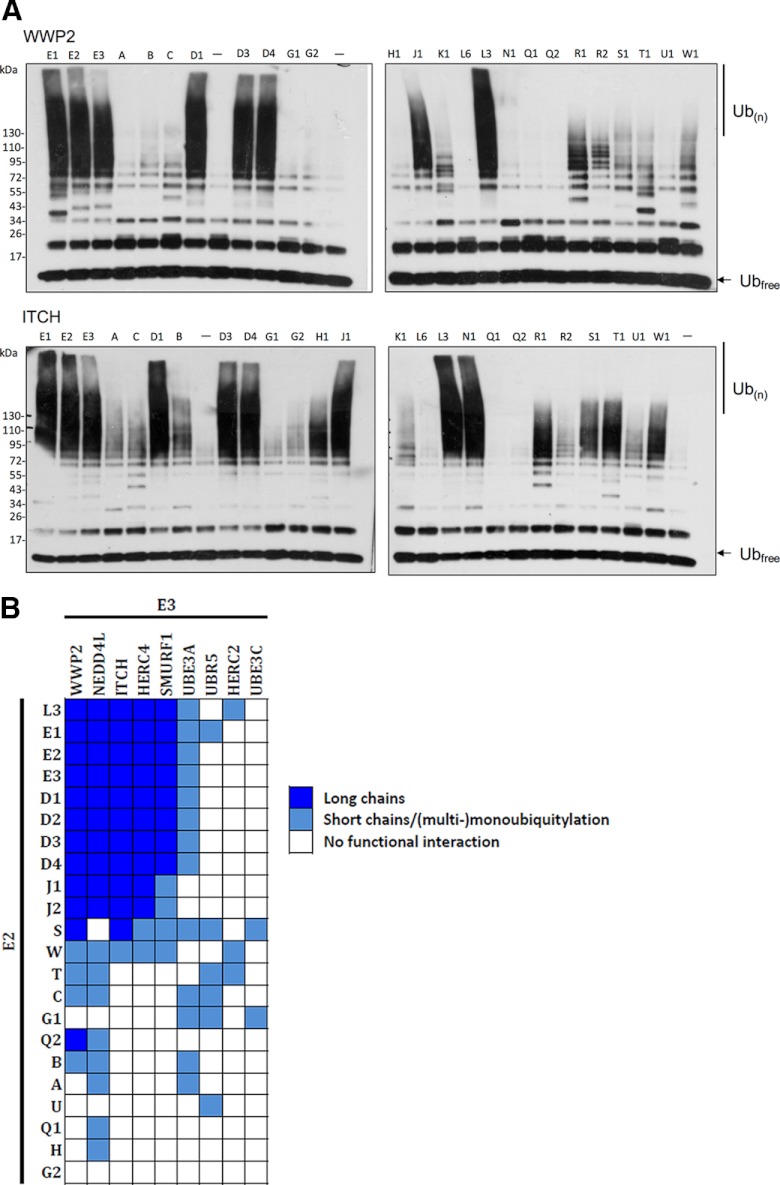
Fig. 2.
Autoubiquitylation reactions. A, Autoubiquitylation was performed in the presence of recombinant E1, ATP, ubiquitin and E2. Reactions were subjected to SDS-PAGE and anti-Ub Western analysis. Shown is a representative screen (with the HECT E3 domains of WWP2 and ITCH), typical of results obtained in three independent experiments. Each lane represents an individual autoubiquitylation reaction with E2 indicated at top. (-) indicates negative control, lacking E2 protein. The locations of unconjugated and oligomeric His-Ub are indicated to the right of each Western blot. B, A heat map depicting Ub chain-building activity of each of the 234 E2-E3 pairs in in vitro autoubiquitylation reactions. Dark blue indicates long Ub chains (>125 kDa), light blue indicates short chains or (multi-) monoubiquitylation, and white indicates no functional interaction. E2s and E3s are hierarchically clustered according to activity.

