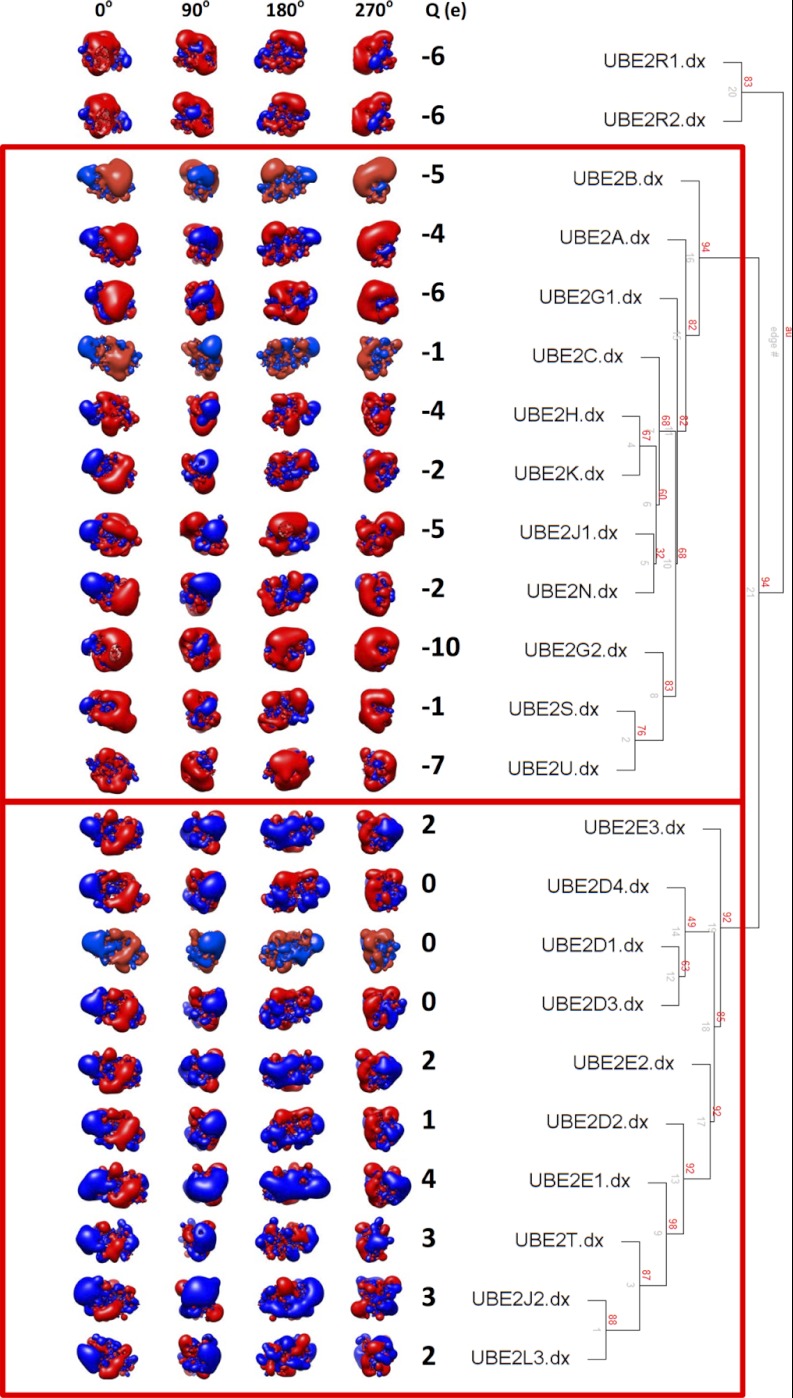
Fig. 3.
left - Spatial distributions of electrostatic potentials of human E2 protein structures; red = acidic, blue = basic at ± 1kBT/e. Four different orientations around the vertical axis are shown, along with net charge (Q(e)) of the full structure. right - An agglomerative hierarchical clustering dendrogram was generated using pvclust, calculated based on the spatial distribution of electrostatic potential within 6Å of the ubiquitin donor interaction interface. Bootstrap probability values (red), and edge numbers (gray) are indicated.

