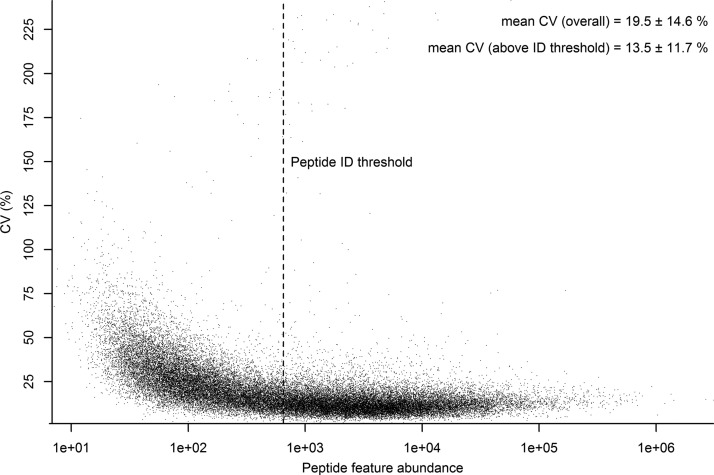
Fig. 1.
Technical variance of peptide feature abundance by label-free LC-MS. The technical variance, as measured by % CV ± standard deviation across six technical replicates of a representative sample, is plotted against their average abundance on the log 10 scale for all 40,444 detected features. The peptide threshold indicates the lowest abundance at which a peptide identity was confidently assigned to an associated MS/MS spectrum.

