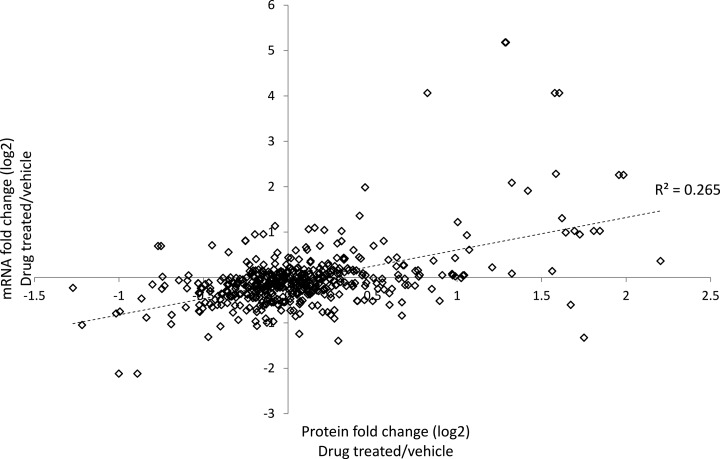
Fig. 3.
Correlation between hepatotoxicant induced changes in protein and corresponding transcript levels. Transcript fold change (log 2) as determined by microarray analysis is shown plotted against the protein fold change (log 2) as determined by label-free LC-MS where accessions could be unambiguously mapped (530 proteins).

