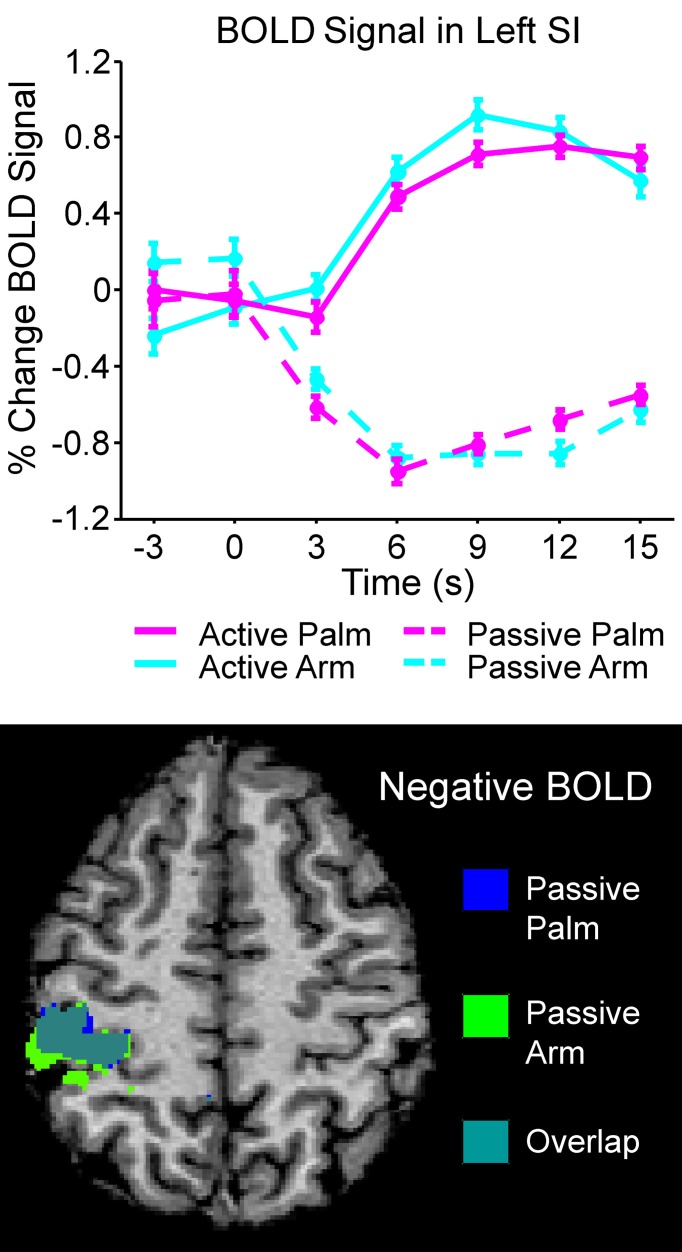
Figure 3.
Overview of the left SI area that showed significant negative BOLD during passive stroking. The top graph shows the time courses of all the conditions in the left SI BA03 area (see Table 1 for more details); in active touch, there was a significant positive BOLD signal changes, whereas in passive touch, there was a significant negative BOLD signal. The bottom panel shows the negative BOLD signal areas for passive touch to the palm and arm; these regions overlapped greatly. The brain map in the bottom panel is to neurological convention (left is left).

