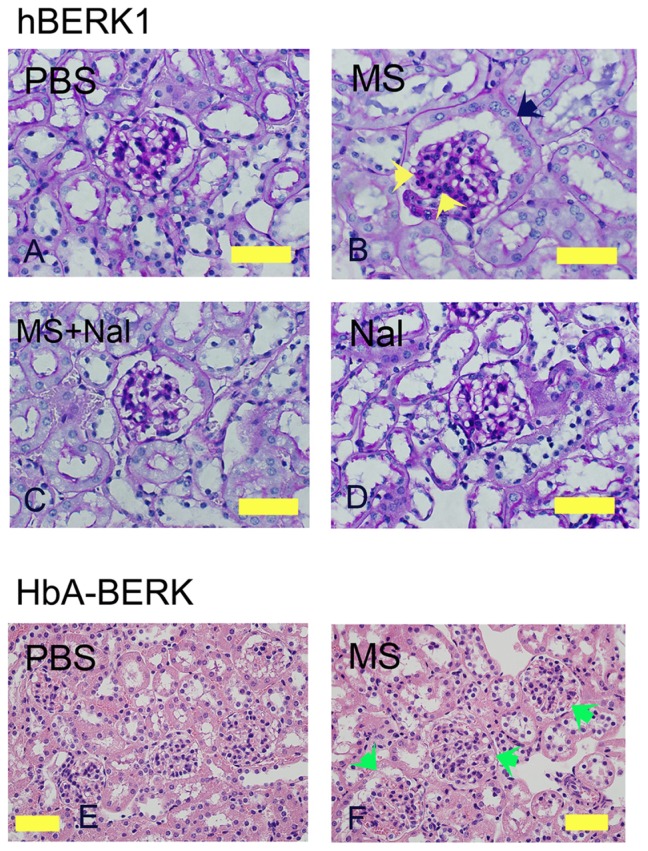
Figure 2.
Morphine treatment exacerbates renal pathology in hBERK1 and HbA-BERK mice. (A–D) PAS-stained kidney sections from hBERK1 mice treated with morphine and/or naloxone for 6 weeks. Note the glomerular enlargement, increased mesangial cell density (black arrow), and parietal cell metaplasia (green arrow) in (B).
Notes: Magnification ×780; scale bar, 50 μM. (E and F) H&E-stained kidney sections from HbA-BERK mice treated with morphine for 6 weeks. Note the glomerular enlargement in F (green arrows). Magnification ×400; scale bar, 125 μM. Each photomicrograph is representative of kidney tissue from 6 mice each.
Abbreviations: H&E, hematoxylin and eosin; HbA, hemoglobin A; MS, morphine sulfate; Nal, naloxone; PAS, periodic acid-Schiff; PBS, phosphate-buffered saline.

