Figure 7.
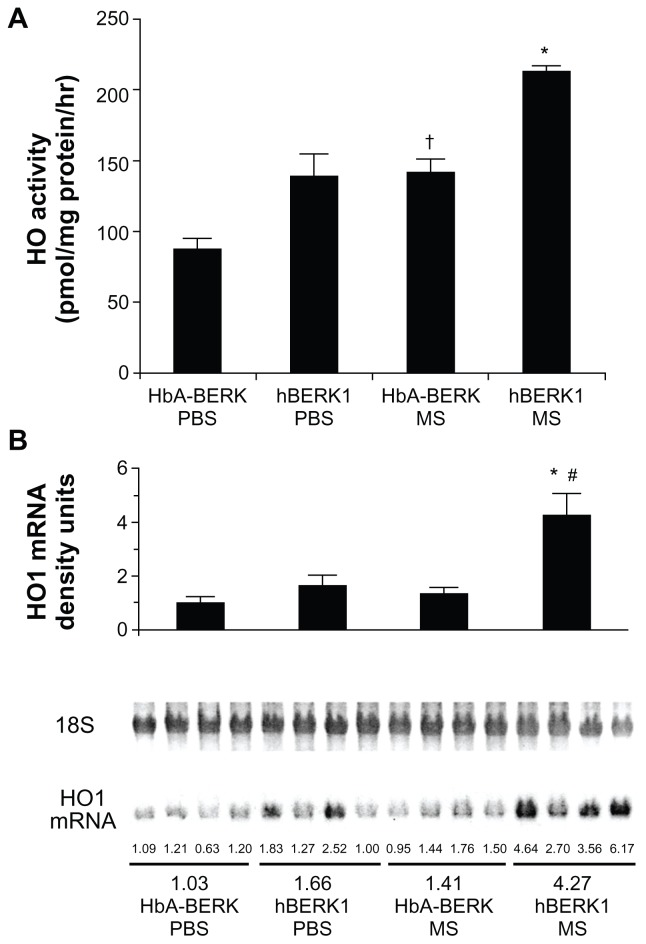
Morphine stimulates heme oxygenase (HO) activity and alters kidney function. (A) HO activity in the kidney of HbA-BERK and hBERK1 mice after 3 weeks of morphine treatment. Each bar represents the mean ± SEM of 4 mice/group. *P < 0.001 compared with hBERK1 mice treated with PBS or HbA-BERK mice treated with MS; †P < 0.01 compared with HbA-BERK PBS. (B) HO1 mRNA expression in the kidney of HbA-BERK and hBERK1 mice after 3 weeks of morphine treatment.
Notes: Each bar represents densitometric units of bands obtained from Northern analysis of RNA from the entire kidney. Values are shown as the mean ± SEM of 4 mice/group. *P < 0.01 compared with hBERK1 mice treated with PBS; #P < 0.001 compared with HbA-BERK mice treated with MS.
Abbreviations: HbA, hemoglobin A; PBS, phosphate-buffered solution; MS, morphine sulfate; HO1, heme oxygenase 1.

