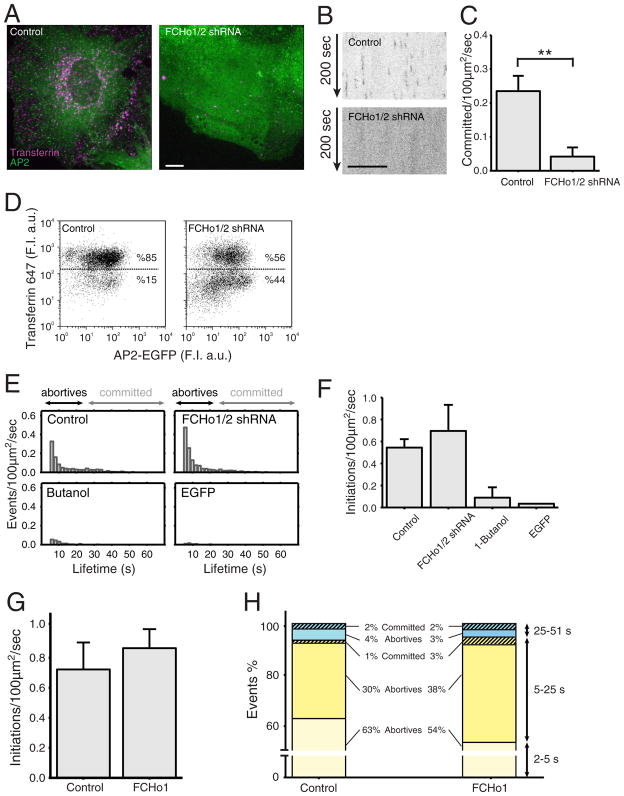
Figure 5. Effect of FCHo proteins on coated pit initiation and formation.
(A) Uptake of Alexa 647 transferrin (magenta) by BSC1 cells stably expressing σ2-EGFP (green) in the presence and absence of FCHo1 and FCHo2. Depletion of FCHo1/2 was obtained after a 4-day incubation with lentivirus encoding short hairpin interfering RNA sequences specific for FCHo1 and FCHo2 (FCHo1/2 shRNA). Cells were incubated for 10 min at 37 °C with 10 μg/ml Alexa 647 transferrin and then imaged in 3D using spinning disk confocal microscopy. The representative images correspond to maximum z-projections from a stack of 35 imaging planes spaced 0.5 μm. Scale bar: 10 μm, for both panels.
(B) Representative kymographs from time series from the bottom attached surface of BSC1 cells obtained by spinning disk confocal microscopy. The cells stably expressing σ2-EGFP were imaged in the presence (top) or absence (bottom) of FCHo1/2. Time series were obtained 4 days after treatment of the cells with lentivirus encoding scrambled or short hairpin interfering RNA sequences specific for FCHo1 and FCHo2. Scale bar: 10 μm, for both panels.
(C) Distributions of the numbers of coated pits longer than 25 s forming in the presence (0.23 +/− 0.045 committed pits/100 μm2/s; total number of pits = 3275) and absence (0.042 +/− 0.027; total number of pits = 1139) of FCHo1/2. Error bars: cell-to-cell standard deviation; **: p<10−4, t-test. Data from 5 cells for each condition.
(D) FACS analysis to follow the uptake of Alexa 647 transferrin by BSC1 cells stably expressing σ2-EGFP in the presence (left) and absence (right) of FCHo1/2.
(E) Number of coated pit events detected by TIRF in the presence and absence of FCHo1/2, respectively. Time series were obtained by imaging every 170 ms with an exposure of 30 ms per frame. The number of committed pits (>25 s) was underrepresented because the length of the time series used was 1 min in duration.
(F) Distributions of fluorescent spots representing the number of initiation events with duration longer than 5 s detected by TIRF microscopy in BSC1 cells stably expressing σ2-GFP; 51 s time series were obtained by imaging every 170 ms with an exposure of 30 ms per frame. The data were obtained from control cells expressing normal amounts of FCHo1 and FCHo2 (0.544 +/− 0.076 initiations/100 μm2/s; N = 4 cells), from cells depleted of FCHo1 and FCHo2 (0. 696 +/− 0.23; N = 3 cells), and from control cells briefly exposed to 1-butanol (0.089 +/− 0.094; N = 3 cells). The last bar shows the distribution of fluorescent spots detected at the plasma membrane of cells expressing soluble, cytosolic monomeric EGFP (0.034; N = 1 cell).
(G) Distributions of the numbers of fluorescent spots representing initiation events (> 2 s) detected by TIRF microscopy in BSC1 cells stably expressing σ2-GFP alone or together with transiently expressed FCHo1. We recorded 51 s time series by imaging every 170 ms with an exposure of 30 ms per frame. The data were obtained both from control cells expressing normal amounts of FCHo1/2 (0.722 +/− 0.179; N = 5 cells) and from cells transiently expressing FCHo1 for three days (0.864 +/− 0.126; N = 5 cells).
(H) The events detected in (G) were divided into three groups: those lasting 2–5 s, 5–25 s, and 25–51 s. The data are color coded to differentiate abortive (full color) from committed pits (striped), the later selected by their higher maximum fluorescence intensity.

