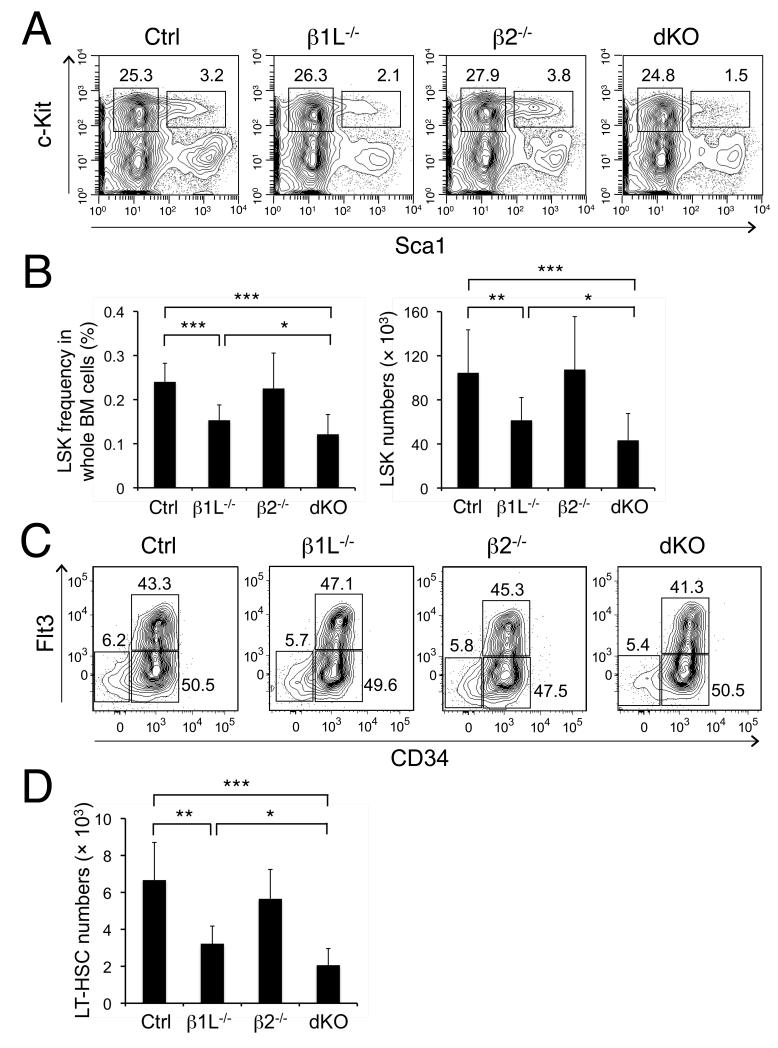
Figure 2. The tetramer-forming GABPβ isoforms are required for HSC maintenance but not for HSC differentiation.
(A) Detection of MPs and LSKs. BM cells from indicated mice were surface-stained, and percentages of MPs and LSKs are shown in representative contour plots (n = 10-12 from 8 experiments). (B) LSK frequency and numbers in whole BM cells. The absolute counts are from 2 tibias and 2 femurs from each mouse. Data are means ± s.d. (n ≥ 10). (C) Detection of LT-, ST-HSCs, and MPPs. The BM LSK cells were further fractionated based on CD34 and Flt3 expression. The percentage of each subset is shown. (D) LT-HSC numbers in whole BM cells. The absolute counts are from 2 tibias and 2 femurs. Data are means ± s.d. (n = 5-6 from 4 independent experiments). *, p < 0.05; **, p < 0.01; ***, p < 0.001.

