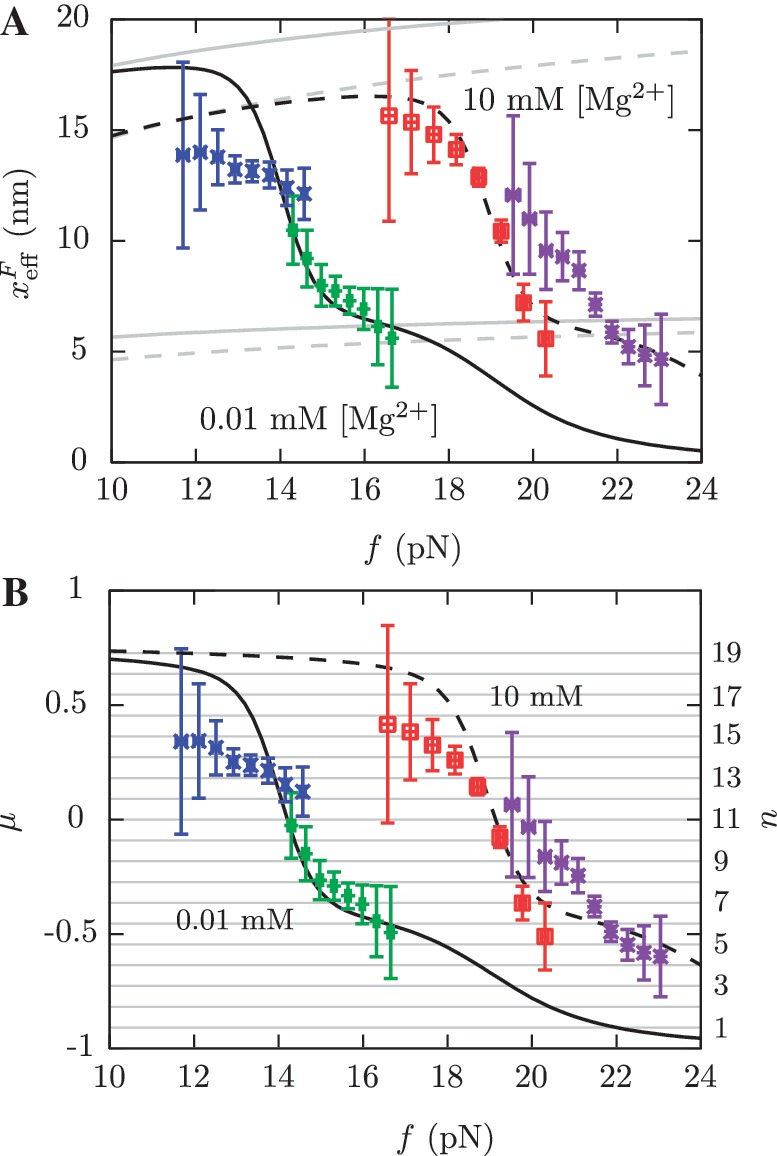
Figure 10.

Barrier location and mechanical fragility at 0.01 mM and 10 mM [Mg2+]. (A) Force-dependence of the barrier position measured with respect to the F state,  . Continuous gray line is the WLC prediction of the molecular extension when n = 19 or n = 6 bps are unzipped at 0.01 mM [Mg2+], and dashed gray line corresponds to the WLC prediction when n = 19 or n = 6 bps are unzipped at 10 mM [Mg2+]. At an intermediate range of force the TS coincides with n = 6 for both ionic conditions. (B) Dependence of fragility μ(f) at 0.01 mM and 10 mM [Mg2+]. Gray lines indicate the value of the fragility for different locations n of the TS along the stem. Continuous black lines are the theoretical prediction using Kramers rate theory for data at 0.01 mM [Mg2+], and dashed black lines for data at 10 mM [Mg2+]. Blue and green points are the experimental evaluation of
  and μ(f) for folding and unfolding data collected at 0.01 mM [Mg2+]. Red and purple points are the experimental evaluation for folding and unfolding at 10 mM [Mg2+].
