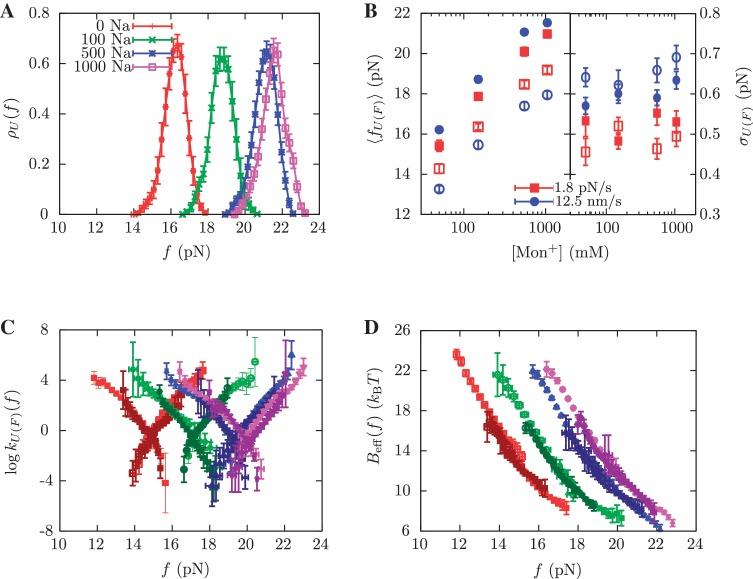
Figure 3.
Kinetic analysis of experiments at varying [Mon+]. (A) Experimental distribution of the unfolding rupture forces in buffers containing 50 mM (red), 150 mM (green), 550 mM (blue) and 1050 mM (magenta) [Mon+]. These experiments were done at a loading rate of 1.8 pN/s. (B) Average rupture forces 〈fU(F)〉 and standard deviations σU(F) as a function of monovalent cation concentration at loading rates of 1.8 pN/s (red) and 12.5 pN/s (blue). Filled symbols refer to unfolding and empty symbols to folding. (C) Log-linear plot of the transition rates versus force. Experiments were done at 50 mM [Mon+] for loading rates of 1.8 pN/s (dark red) and 12.5 pN/s (red), at 150 mM [Mon+] for loading rates of 1.8 pN/s (dark green) and 12.5 pN/s (green), at 550 mM [Mon+] for loading rates of 1.8 pN/s (dark blue) and 12.5 pN/s (blue), and at 1050 mM [Mon+] for loading rates of 1.8 pN/s (dark violet) and 12.5 pN/s (magenta). (D) Dependence of the effective barrier Beff(f) on force at different [Mon+]. Color code as in (C).

