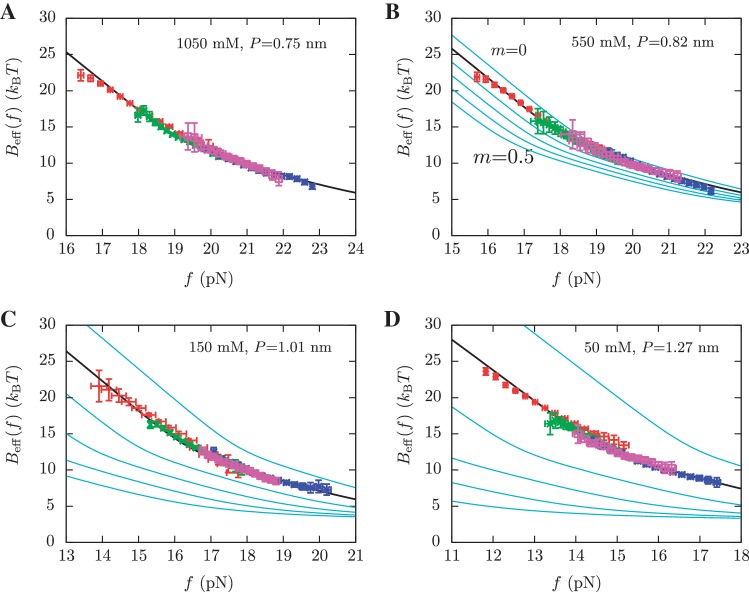
Figure 4.
Determination of the salt correction parameter m. Experimental evaluation of the sequence-independent correction parameter m from g1([Mon+]) = m log([Mon+]/1000) using Equation 10. Estimators of  obtained experimentally (Equation 10) were compared with the expected
  (Equation 7) profiles for different values of m (0, 0.1, 0.2, 0.3, 0.4 and 0.5 from top to bottom). Red (green) points are the experimental estimators
  at a pulling rate of 12.5 (1.8) pN/s. Blue (magenta) points are the experimental estimators of
  at a pulling rate of 12.5 (1.8) pN/s. Light blue lines are the
  profiles for values of m not matched, and black lines are the experimental estimators of Beff(f) that match with experiments. Application of the method to experiments done at 1050 mM [Mon+] (A), 550 mM [Mon+] (B), 150 mM [Mon+] (C), and 50 mM [Mon+] (D).

