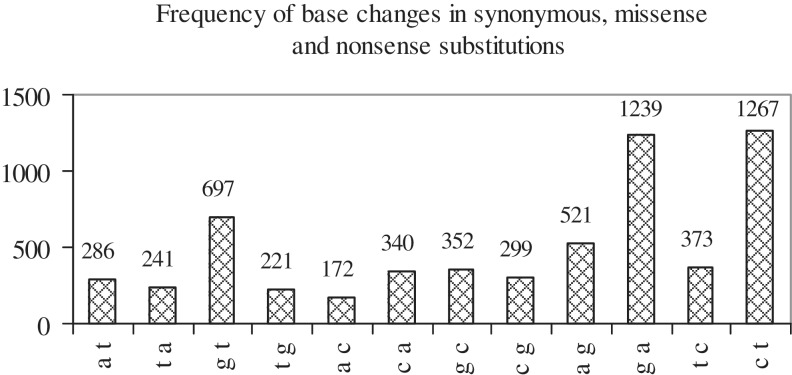
Figure 2.
Histogram showing the frequency of occurrence of each of the 12 possible base changes when all substitution mutations (synonymous, missense, nonsense), occurring at pos1, pos2 and pos3 of codons, are considered. Base changes are indicated along the x-axis and their frequencies are indicated along the y-axis.

