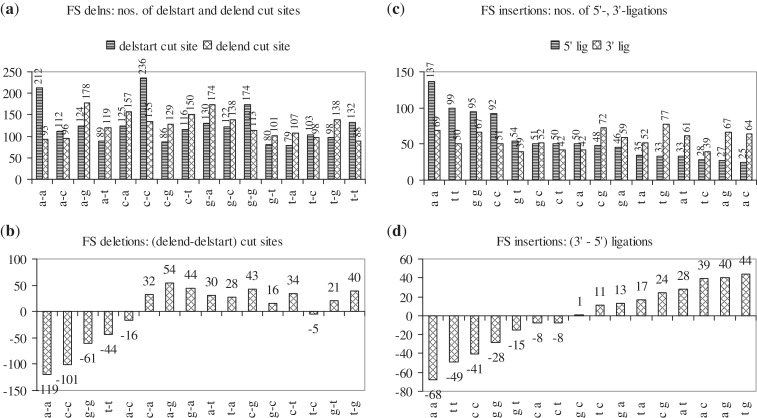
Figure 5.
Histograms showing the frequency with which each of 16 pairs of adjacent nt are cut at the start and end of FS deletions (a and b), and occur as 5′- and 3′-ligations in FS insertions (c and d). In (a), the two series show the frequencies with which each nt pair (e.g. a-a) is cut at the start and end of FS deletions [212, 93]; the difference between the two frequencies for each nt pair [119] is given in (b). In (c), the two series show the frequencies with which each nt pair (e.g. a-a) forms 5′- and 3′-ligations in FS insertions [137, 69]; the difference between the two frequencies for each nt pair [68] is given in (d).

