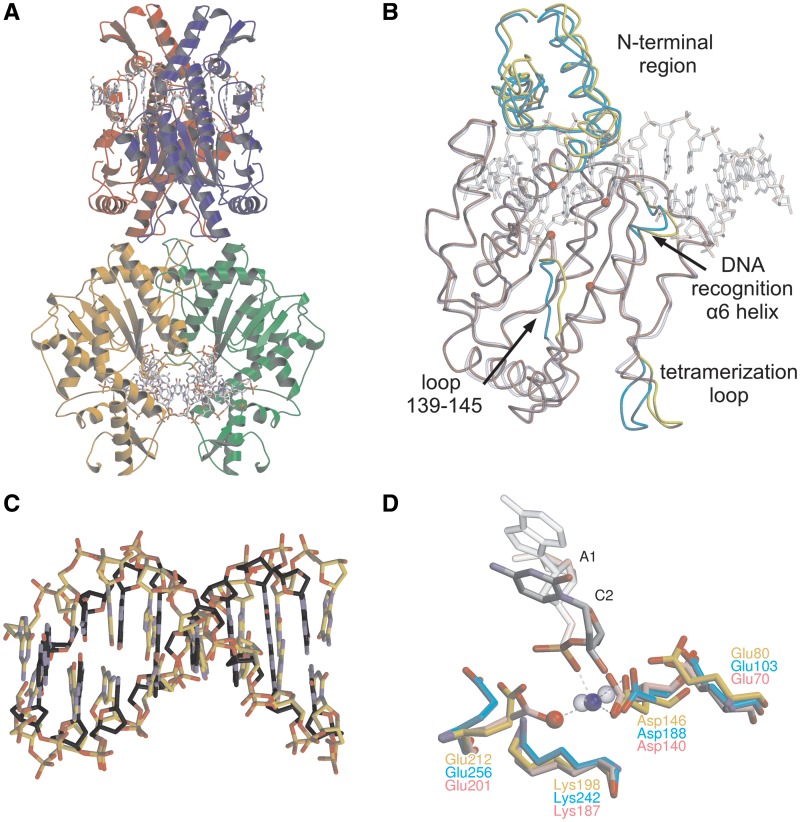
Figure 1.
The crystal structure of Bse634I (R226A)–DNA complex. (A) General architecture of the tetramer bound to the GC-1 oligoduplex. Individual monomers are shown in different colors. Two DNA molecules bound by Bse634I are in a ball-and-stick representation. (B) Superposition of DNA-free Bse634I (PDB ID 1KNV) monomer A (transparent blue) with the monomer A (red) in the Bse634I–GC-1 complex. Protein chains are traced by Cα, DNA is shown in a transparent ball-and-stick representation and CPK colors. Protein chain fragments that differ in both structures are cyan and yellow for apo- and DNA bound monomers, respectively. Cα atoms of the catalytic motif (Glu80, Asp146, Lys198 and Glu212) are shown as red spheres. (C) Superposition of the eight central base pairs (recognition site and adjacent flanking base pairs) of the GC-1 oligoduplex complexed with Bse634I (gold) and B-form DNA of the same sequence generated by NAB software (grey). (D) Superposition of the catalytic center residues of the Bse634I and AT-1 complex (gold) and corresponding residues in NgoMIV–DNA (PDB ID 4ABT, pink) and SgrAI–DNA (PDB ID 3DVO, cyan) complexes. Ca2+ is shown as a blue sphere, a water molecule as a red sphere. Ca2+ in the active sites of NgoMIV and SgrAI are shown as blue transparent spheres.

