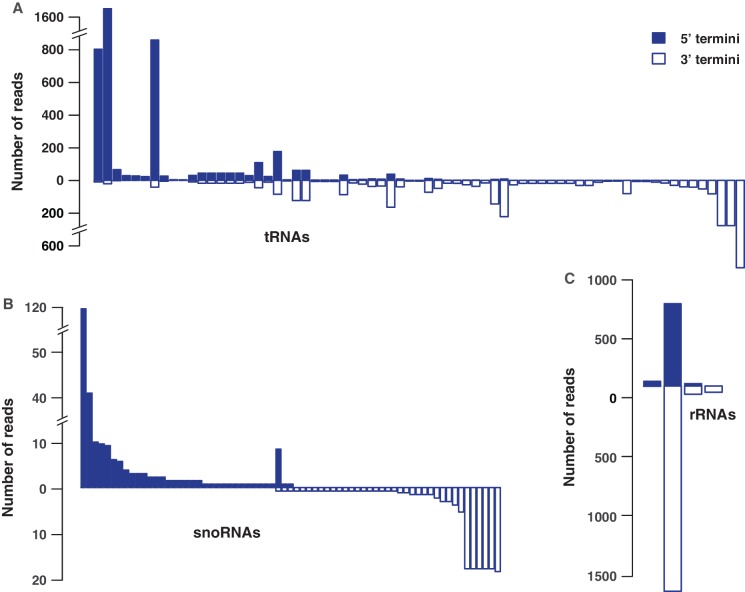
Figure 3.
Terminal small RNA fragments from tRNAs, snoRNAs and rRNAs manifest a bias for either 5′ or 3′ processing. (A) Abundance of 5′ (solid blue) and 3′ (blue) terminal RNAs produced from individual tRNAs (X-axis). For clarity, illustration is limited to non-redundant tRNA sequences producing at least 10 reads (per million) of terminal RNAs. Similar patterns are observed for snoRNAs (B) and rRNAs (C). Profiles of snRNAs are omitted because they yield terminal RNAs exclusively from their 3′ end (Figure 2).

