
Figure 5.
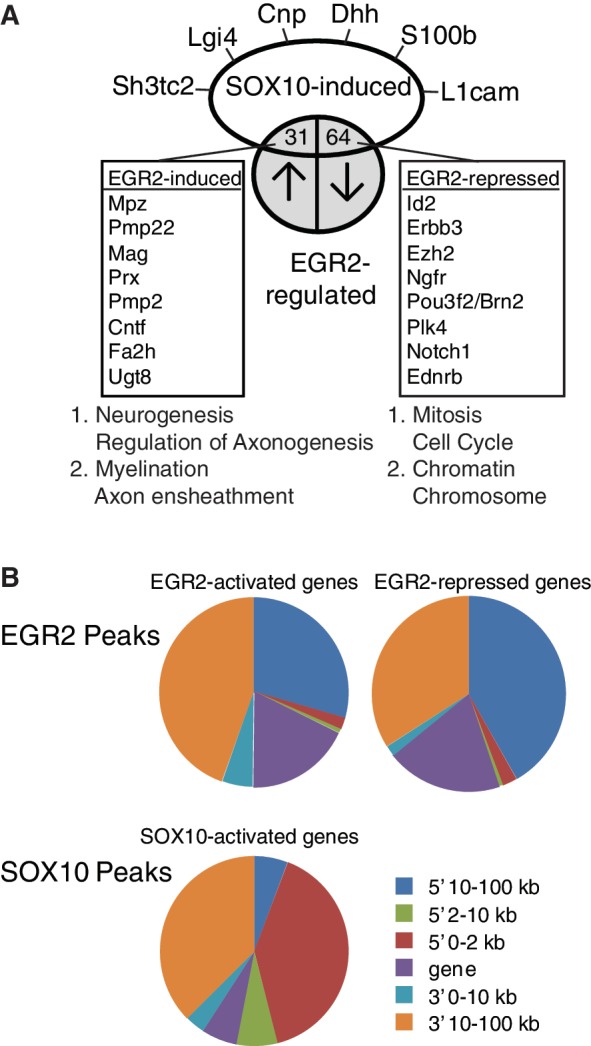
Analysis of SOX10-regulated genes. (A) Sox10 siRNA was introduced into the rat S16 cell line, and microarray analysis of three independent replicates was used to identify SOX10-regulated genes. Comparison with array data from the Egr2 hypomorph allele at P7 revealed a subset of genes that are positively regulated by both EGR2 and SOX10, and another set of genes that are apparently SOX10 induced, but repressed by EGR2 activity in post-natal Schwann cells. Functional annotation clustering performed by DAVID revealed clusters associated with the indicated terms (see Supplementary Table S8 for complete listing). (B) Peak location analysis was performed for those peaks located within 100 kb of genes that are repressed or activated by EGR2 or SOX10, as determined by microarray analysis of Egr2 hypomorphic mice (5,46) or siRNA analysis of SOX10-regulated genes in the S16 cell line (Supplementary Table S6). Pie charts represent relative proportions of peaks located within the gene body itself (gene), or 0–2, 2–10 and 10–100 kb away from the gene on either the 5′ or 3′ side. Peaks >100 kb are not included in the analysis. SOX10 peaks in SOX10 repressed genes are not included because of the low number of such peaks.