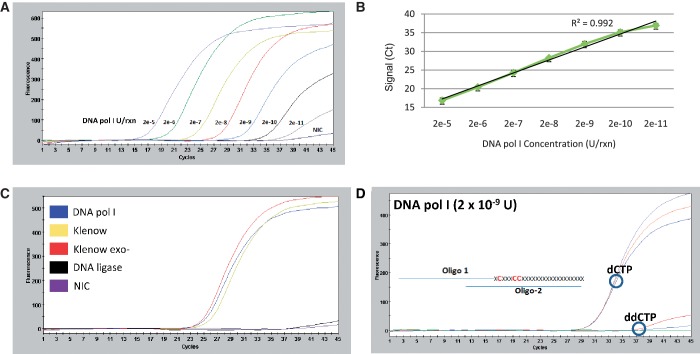
Figure 2.
Sensitive detection of purified DNA polymerase using DPE-PCR. (A) A commercial source of DNA polymerase I was assayed in duplicate at 10-fold increments starting at 2 × 10⁻⁵ U down to 2 × 10⁻¹¹ U per reaction. A representative DPE-PCR curve is shown for each polymerase input level and NIC. (B) A plot was constructed from n = 4 data points per polymerase input level, taken from two independent experiments and linear regression analysis was performed. (C) Triplicate reactions containing 2 × 10⁻⁷ U of DNA polymerase I, Klenow, Klenow (exo−) and E. coli DNA Ligase were assayed in comparison to an NIC. A representative DPE-PCR curve is presented for each of the assayed enzymes and NIC. (D) Triplicate DPE-PCR curves are shown from corresponding DPE reactions containing a 50 -µM (dATP, dGTP, dTTP) mixture supplemented with 50 µM of either dCTP or ddCTP. A schematic representing some of the first available sites for dCTP or ddCTP incorporation within the DNA substrate is presented adjacent to the DPE-PCR curves.

