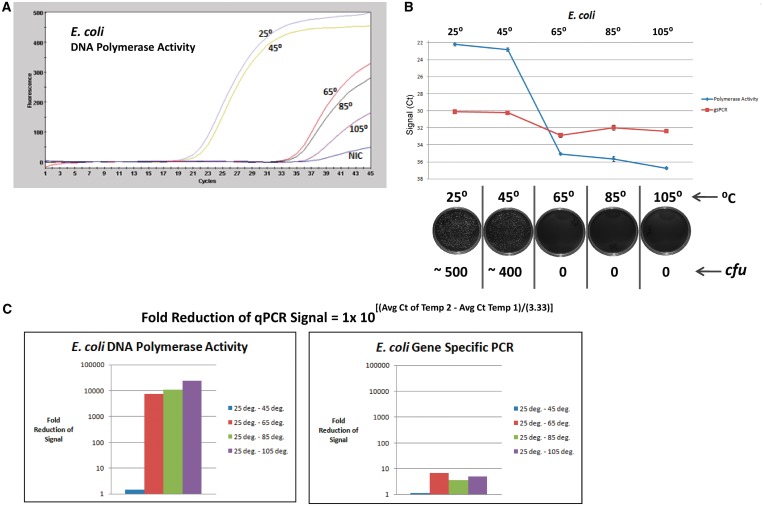
Figure 6.
DPE-PCR as an indicator of E. coli viability in response to heat treatment. (A) Aliquots of an E. coli suspension (∼2000 cfu/µl) were incubated at 25°C, 45°C, 65°C, 85°C and 105°C for 20 min. After heating, each bacterial stock was cooled to room temperature and 5 µl were transferred to the bead lysis-coupled DPE-PCR assay. DPE-PCR curves representing E. coli-derived DNA polymerase activity following each of the indicated temperature treatments are presented. (B) Plots were generated from triplicate DPE-PCRs and gsPCR of genomic DNA (from the same lysates) after the indicated temperature treatments of E. coli suspensions. Parallel plating was also performed in triplicate for each of the treated E. coli suspensions. Representative colony forming unit monitoring plates are presented below the graph, revealing bacterial viability status after treatment at each temperature. (C) DPE-PCR is compared with gsPCR of genomic DNA in response to the various temperature treatments. ‘Fold Reduction of qPCR Signal’ was calculated using the indicated equation and the values obtained were used to generate comparative bar graphs.

