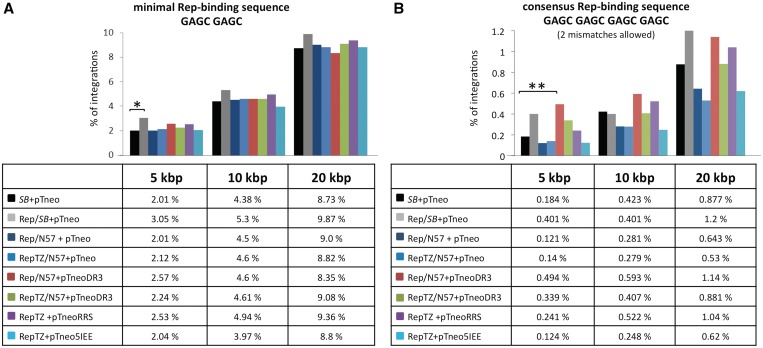
Figure 8.
Mapping of SB transposon integrations in proximity to chromosomal Rep-binding motifs. Transposon insertions were recovered from HeLa cells transfected with the components of the targeting system. Sequences neighbouring the insertion sites were analysed with respect to proximity to Rep-binding sites. Calculations were performed with the minimal Rep-binding sequence GAGC GAGC (A) and the consensus Rep-binding sequence GAGC GAGC GAGC GAGC with up to two mismatches (B). Distances were categorized in 5-, 10- and 20-kb windows around putative Rep-binding sites and the percentage of insertions obtained in the presence and absence of the targeting fusion proteins in each category are shown. The percentage of integrations that occurred in the designated windows is represented as bars. The results of statistical tests comparing the distribution of integration sites generated by the targeting proteins to those generated by unfused SB are summarized as asterisks on top of each bar. P-values > 0.05 were not considered statistically significant. *P-values < 0.05 were considered significant and **P-values < 0.01 were considered highly significant.

