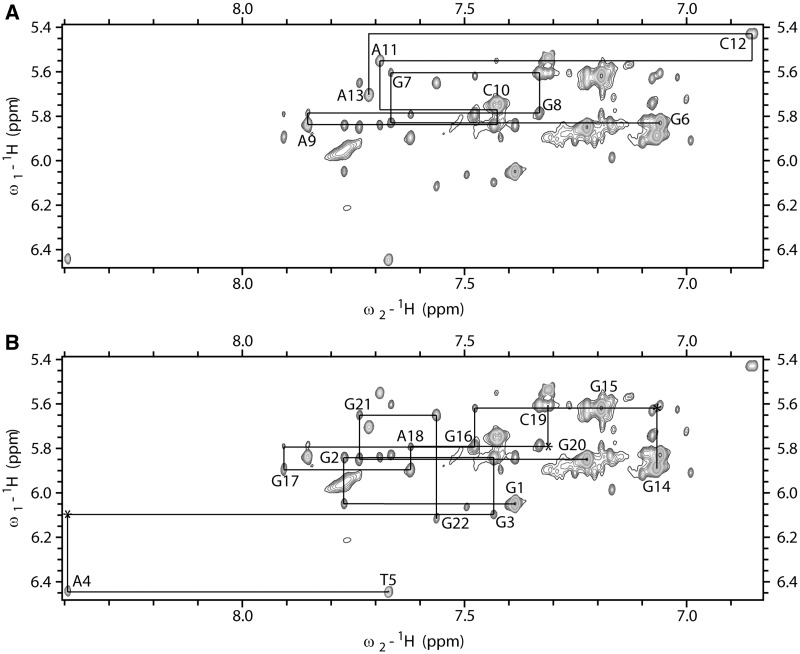
Figure 4.
The aromatic–anomeric region of 2D NOESY spectrum (τm = 150 ms) of ODN. The lines connect aromatic H6/H8–sugar H1' NOE cross-peaks. Sequential connectivities for (A) G6-A13 segment and (B) G1-T5 and G14-G22 segments are shown separately to reduce cross-peaks’ overlap. Missing cross-peaks are designated with asterisk. 2D NOESY spectrum was recorded at 800 MHz, 25°C in 10% 2H2O, 50 mM KCl, 10 mM phosphate buffer with pH 6.8. Oligonucleotide concentration was 1.7 mM.

