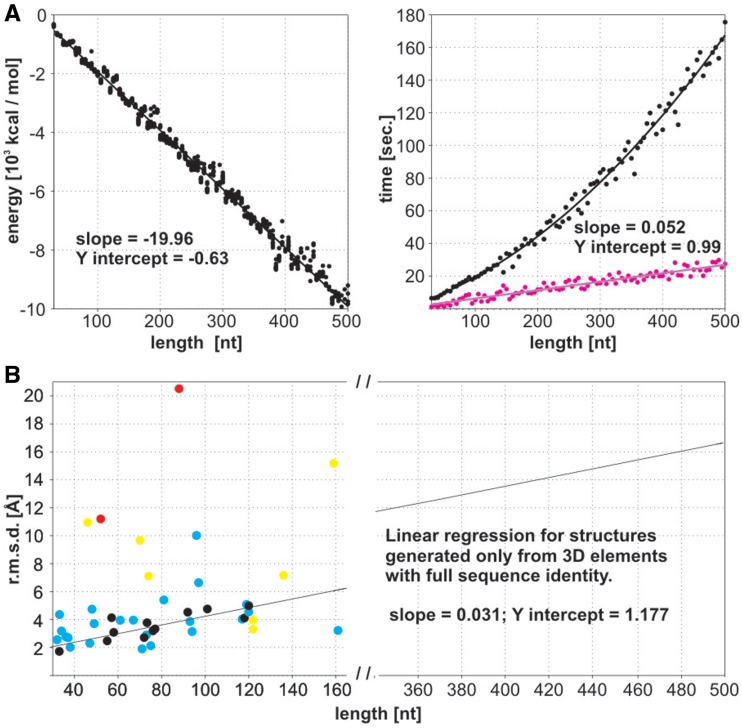
Figure 2.
(A) Energy and prediction time estimation for final 95 RNA 3D structures (length 30–500 nt; marked in black). Computing time for the initial RNA structures is marked in purple. (B) Method accuracy estimation (heavy atom r.m.s.d.) for a benchmark set of 40 RNAs (30–161 nt) indicated in Table 1. The final structures represent four groups: (black) composed of 3D elements with full sequence identity, (blue) with over 50% sequence identity, (yellow) including elements with low sequence identity and (red) including generated elements due to their absence in the dictionary. It should be underlined that, upon this test, all the 3D structure elements comprised by their respective crystal PDB structure were excluded from the dictionary.

