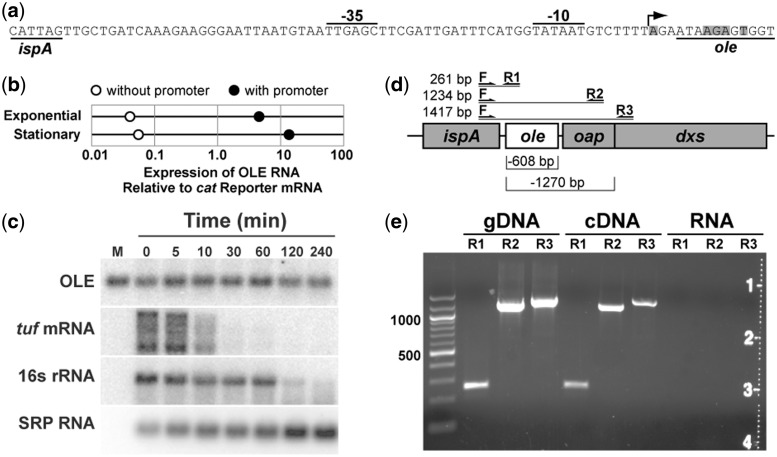
Figure 2.
Expression and stability of OLE RNA. (a) Sequence of the predicted promoter for OLE RNA synthesis. The predicted transcription start site is indicated by an arrow. Shaded nucleotides identify ends of natural OLE RNAs as previously determined by using 5′ RACE (11). (b) Relative expression of OLE RNA from a plasmid with and without the promoter region. Expression levels were determined in B. halodurans lacking its genomic OLE RNA gene under exponential growth or stationary phase as indicated. Analyses were conducted by qRT-PCR and values were normalized to expression of the mRNA for the antibiotic resistance gene on the plasmid. (c) RNA decay analysis in B. halodurans cells treated with 100 μg ml−1 rifampicin. Each lane contains an equal amount of total RNA and was examined by northern blot analysis using radiolabeled probes for the transcripts indicated. M, in vitro transcribed OLE RNA marker; tuf, transcription elongation factor Tu; SRP RNA, SRP RNA component. (d) Locations of PCR primer-binding sites used to search for spliced transcripts. Lines indicate predicted sizes for full-length transcripts, while brackets (below) indicate potential deletions in spliced products. (e) RT-PCR products of OAP RNA transcripts. Primer pairs as described in (d) were used to amplify (30 thermocycles) genomic DNA, cDNA or total RNA (no cDNA synthesis).

