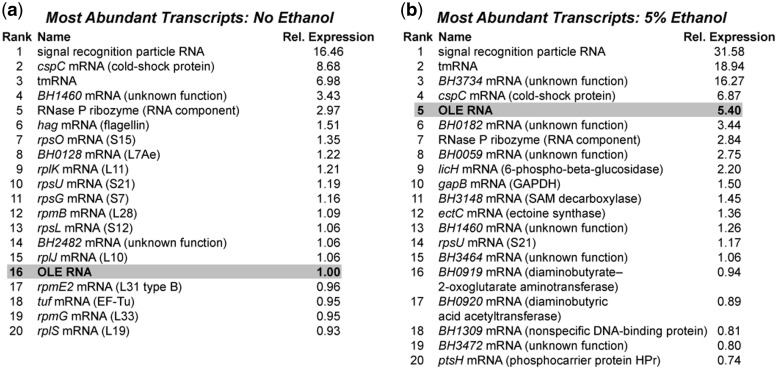
Figure 5.
Whole-transcriptome sequencing (RNA-seq) results for WT B. halodurans cells before (a) and after (b) 3 h exposure to 5% ethanol. The top 20 RNA transcripts in each condition are listed, as determined by RPKM score (reads per kilobase per million reads) (33), excluding rRNAs and tRNAs. All expression levels are relative (Rel. Expression) to OLE RNA in the absence of ethanol, and each list represents the average of RNA-seq data from two independent experiments.

