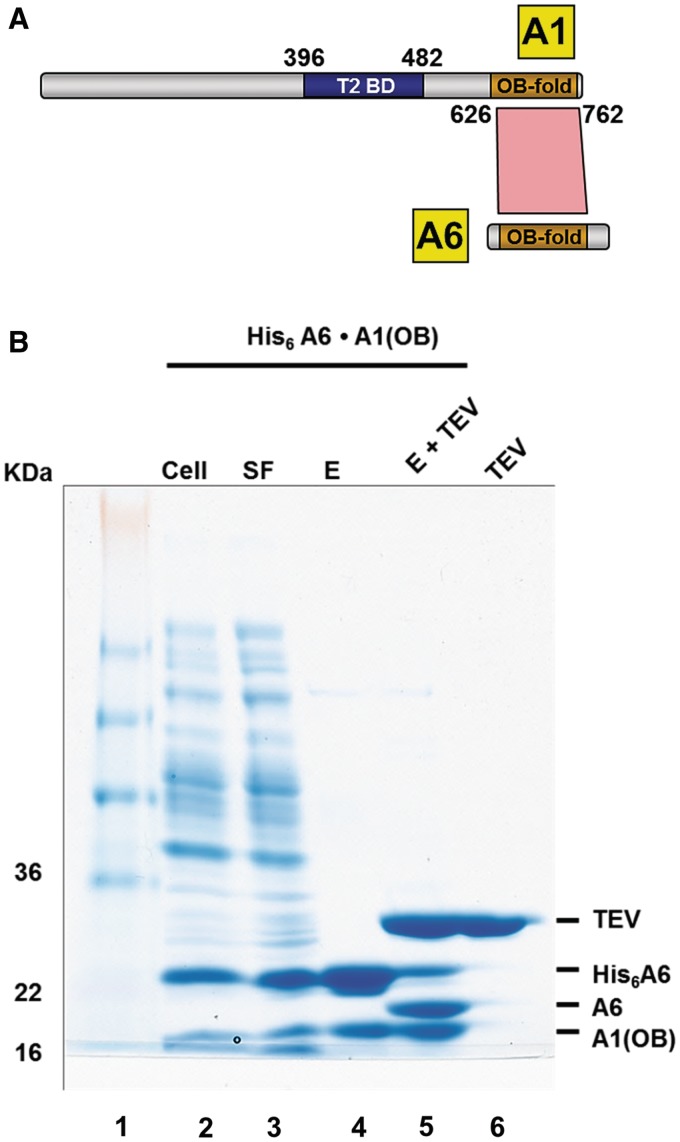
Figure 1.
T. brucei A1OB and A6 interact with each other. (A) The T2-binding domain (T2BD) and OB-fold domain arrangement in A1. A schematic representation of full length A1 and full length A6 with their interaction domains is shown with the T2BD of A1 in blue and the OB folds of A1 and A6 in gold. Direct interactions, as identified by bacterial co-expression and purification, are shown as a red polygon. The T2-binding domain (T2BD) of A1 had been identified before (17). (B) Co-transformation and expression of A1OB and A6 constructs. T. brucei A6 containing a His6-tag at the N-terminus co-transformed into Escherichia coli cells with A1OB (residues 626–762) was co-expressed. Cells were lysed and the His6-tagged A6•A1OB complex was captured by incubating the lysate with Ni-NTA beads (lane 2–4). The His6-tag peptide was cleaved off by TEV. This loss of the His6-tag peptide is evident in the reduced size of the now untagged A6 (lane 5). Abbreviations used in this and in the following figures: Cell, total lysate from induced cells; SF, soluble fraction; E, Ni-NTA elution fractions; E + TEV, eluate from first Ni-NTA after treatment with TEV protease; TEV, tobacco etch virus (TEV) protease. The positions and sizes (kDa) of marker polypeptides are indicated on the left.

