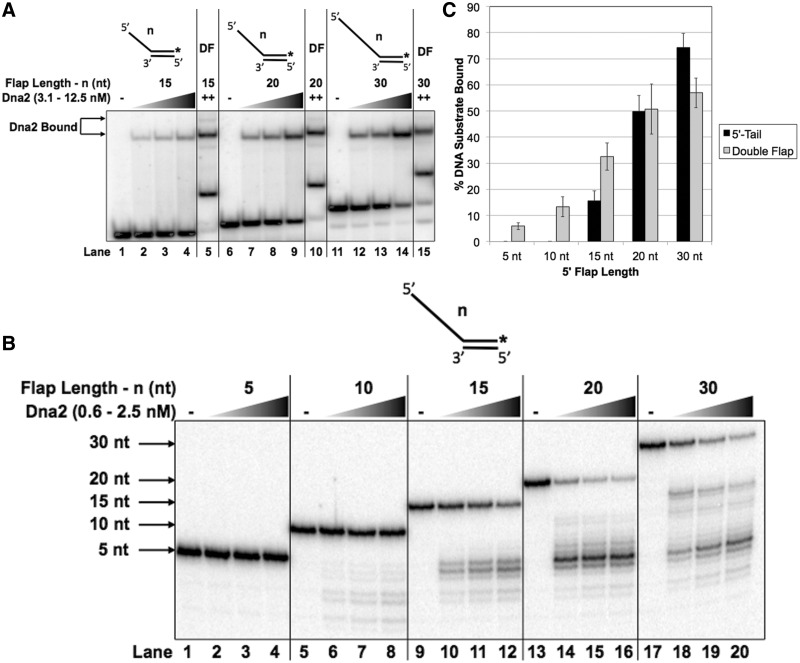
Figure 2.
Dna2 demonstrates reduced binding for intermediate 5′-tail structures relative to double flaps. (A) shows Dna2 binding to the 5′-tail substrates having a 5′ flap of 15 nt (T2:D1.15), 20 nt (T2:D1.20) or 30 nt (T2:D1.30). The double-flap substrates have a 5′ flap of 15 nt (U1:T1:D1.15), 20 nt (U1:T1:D1.20) or 30 nt (U1:T1:D1.30). Binding was measured by EMSA using increasing Dna2 concentrations (3.1, 6.25 or 12.5 nM). (B) shows Dna2 cleavage of 5′-tail substrates having a 5′ flap of 5 nt (T2:D1.5), 10 nt (T2:D1.10), 15 nt (T2:D1.15), 20 nt (T2:D1.20) or 30 nt (T2:D1.30). Cleavage was measured by denaturing gel electrophoresis using increasing concentrations of Dna2 (0.6, 1.25 or 2.5 nM). (C) shows the graphical quantitation of 12.5 nM Dna2 from (A). In (A), the position of the Dna2–substrate complex is indicated to the left of the figure. ‘++’ represents the maximum concentration of Dna2 used. ‘DF’ represents the lane containing the double-flap structure. In (B), the position of the radiolabeled oligonucleotide is indicated to the left of the figure. The experimental 5′-tail substrate configuration is shown above each figure where ‘n’ represents the length of the 5′ flap.

