Figure 5.
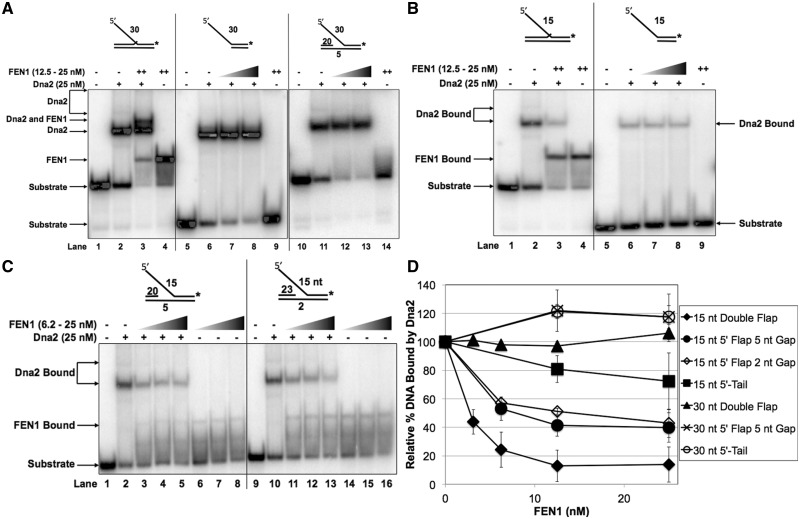
Binding affinity from the upstream DNA as well as a short 5′ flap is necessary for Dna2 displacement by FEN1. Dna2 (25 nM) was pre-incubated with the experimental substrate prior to the addition of increasing concentrations of FEN1 (6.25, 12.5 or 25 nM as indicated in the figure headings). (A) shows Dna2 and FEN1 binding competition for the 30 nt double-flap substrate (U2:T3:D2.30), the 5′-tail substrate (T4:D2.30) and the 5 nt gap-flap (U3:T3:D2.30). (B) shows Dna2 and FEN1 binding competition for the 15 nt double-flap substrate (U2:T3:D2.15) and the 5′-tail (T4:D2.15). (C) shows Dna2 and FEN1 binding competition for the 5 nt gap-flap (U3:T3:D2.15) and 2 nt gap-flap (U4:T3:D2.15) having a 15 nt 5′ flap. (D) shows the graphical quantitation of the relative percent Dna2 bound to the substrate in the absence of FEN1 or with increasing concentrations of FEN1 as defined in the ‘Materials and Methods’ section. In (A)–(C) the position of the Dna2–substrate complex and FEN1–substrate complex are indicated to the left and/or right of the figure. In (A), the FEN1–Dna2–substrate complex is indicated to the left of the figure. ‘++’ represents the maximum concentration of FEN1 used.

