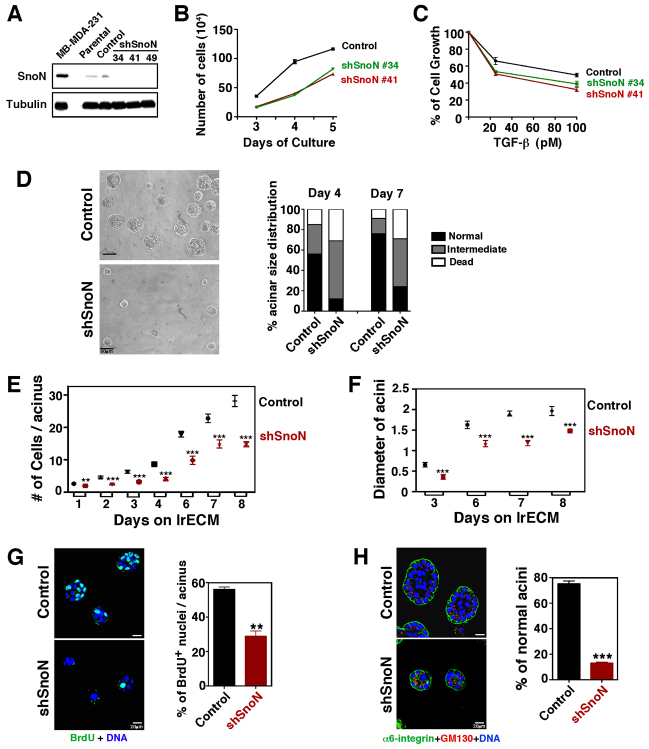
Fig. 3.
SnoN maintains cell growth, polarity and differentiation. (A) Western blotting with anti-SnoN in controls and three shSnoN-expressing MCF-10A clones. Anti-α-tubulin was used as a loading control. MDA-MB-231 breast cancer sample was used as a positive control. (B) Growth curve of the MCF-10A clones. Cells in triplicates were counted at days 3, 4 and 5. (C) Growth inhibition assay. Cells were incubated with 25 pM or 100 pM of TGF-β1, and cell growth was compared with that of unstimulated cells (as 100%). (D) Left: phase contrast images of cells in 3D lrECM for 6 days. Right: quantification of acinar size distribution in the control and shSnoN 3D cultures at day 4 and day 7. (E) Quantification of the number of cells per acinus in the 3D cultures at days 1 (P=0.0023), 2 (P<0.0001), 3 (P<0.0001), 4 (P<0.0001), 6 (P<0.0001), 7 (P=0.0002) and 8 (P<0.0001). (F) Quantification of the diameter of acini in 3D cultures at days 3 (P=0.0007), 6 (P=0.0023), 7 (P<0.0001) and 8 (P<0.0001). (G) Left: BrdU stain of the 3D culture at day 3. Quantification of the BrdU-positive nuclei (three experiments, P=0.0012) is shown to the right. (H) Left: equatorial confocal microscopic images of acini cultured in lrECM for 6 days stained with anti-α6-integrin (green), anti-GM130 (red) and DAPI (blue). Right: the percentage of normal acini in the control and shSnoN 3D cultures at day 6 (P<0.0001). Data represents mean ± s.e.m. from five independent experiments.

