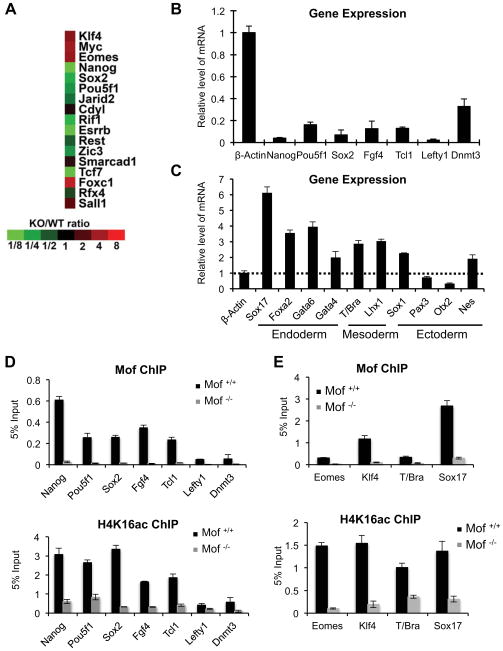
Figure 3. Mof regulates ESC core transcription network.
(A) Heat map of expression of conserved Nanog and Oct4 joint targets (Loh et al., 2006) in WT and Mof −/− ESCs. Fold change of gene expression relative to WT ESCs was indicated at bottom. (B, C) Real-time PCR analyses for pluripotency (B) and differentiation genes (C) in Mof −/− and Mof +/+ ESCs as indicated. All mRNA levels were normalized against β-actin and were presented as relative expression in Mof null versus wild type ESCs. (D) ChIP for pluripotency genes that were down regulated in Mof −/− ESCs. (E) ChIP for differentiation genes that were up regulated in Mof −/− ESCs. For (D–E), primer sets were designed corresponding to Mof binding peaks identified by ChIP-seq (indicated in Supplementary Figure 6). The antibody was indicated on top. Signals for each experiment were normalized to 5% input. For (B–E), Means and standard deviations (as error bars) from at least three independent experiments were presented. Also see Supplementary Fig 6.

