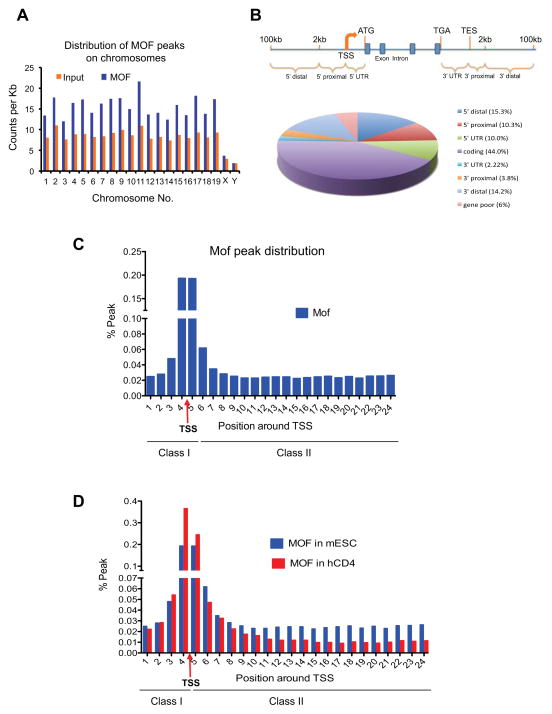
Figure 4. ChIP-seq analysis of Mof binding sites in ESCs.
(A) Chromosome-distribution of Mof binding peaks in mouse ESCs. Y-axis, count of ChIP-seq reads per kilo base. X-axis, chromosome name. (B) Distribution of Mof binding sites relative to nearest Refseq genes. Top, schematic for eight counting categories. Bottom, pie chart for percentage distribution of Mof peaks in each category. (C) Distribution of Mof peaks in a 12kb region from −2kb to +10kb around TSS (indicated by red arrow). Y-axis, percentage of Mof peaks relative to total Mof peaks within the defined region. X-axis, bin numbers, with each represents a 500bp region. Mof peaks were indicated as class I and class II peaks on bottom. (D) Comparison of Mof distribution within the defined 12kb region in mESCs (blue) and human CD4+ cells (red). TSS and Class I and II sites were indicated on bottom. Also see Supplementary Fig 4

