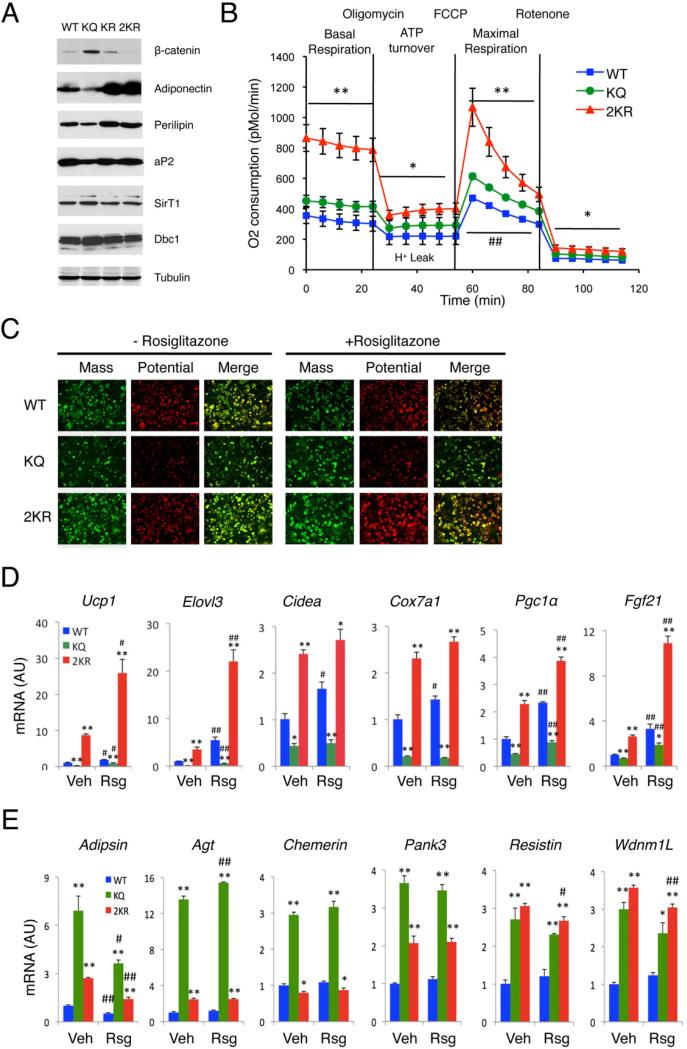
Figure 6. Deacetylation of Pparγ is required for its browning function.
(A) Western blots analyses of Swiss 3T3 fibroblasts expressing WT, K293R (KR), K293Q (KQ) and K268R/K293R (2KR) Pparγ on day 6 of differentiation.
(B) Oxygen consumption rates (OCR) in fully differentiated cells (Day 8). *: P<0.05, **: P<0.01 for 2KR vs. WT cells; #: P<0.05, ##: P<0.01 for KQ vs. WT, n=6-7. The higher basal OCR in cells expressing the KQ mutant is likely due to increased cell number, owing to their shorter doubling time (Figure S6B).
(C) Mitochondrial mass (green) and membrane potential (red) on day 8 of differentiation.
(D-E) Brown gene (D) and white gene expression (E) on day 8 in cells treated with vehicle (Veh) or rosiglitazone (Rsg) overnight. *: P<0.05, **: P<0.01 vs. WT cells; #: P<0.05, ##: P<0.01 vs. untreated cells (n=3). Values are presented as means ± SEM.
See also Figure S6.

