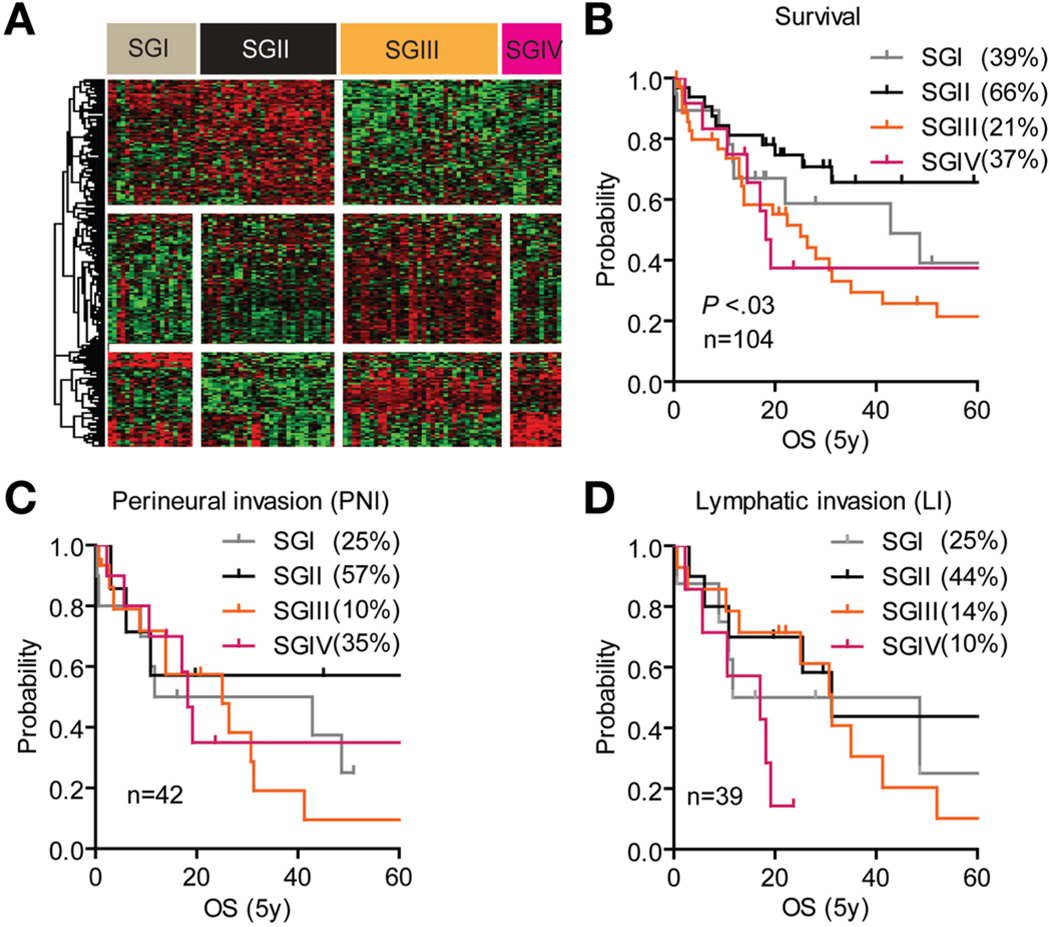
Figure 2.
Supervised class comparison identifies 4 subgroups. (A) Supervised hierarchical cluster analysis of 212 genes identified as differentially regulated between SGI and SGII (127 genes) and between SGIII and SGIV (85 genes). Class comparison using random variance modeling (10,000 permutations; P < .001) was used to identify the significant genes between the subgroups. (B–D) Analysis of (B) overall survival, (C) perineural invasion, and (D) lymphatic invasion as independent prognostic predictors within SGI–IV. Kaplan–Meier and log-rank statistics were used to determine levels of significance.

