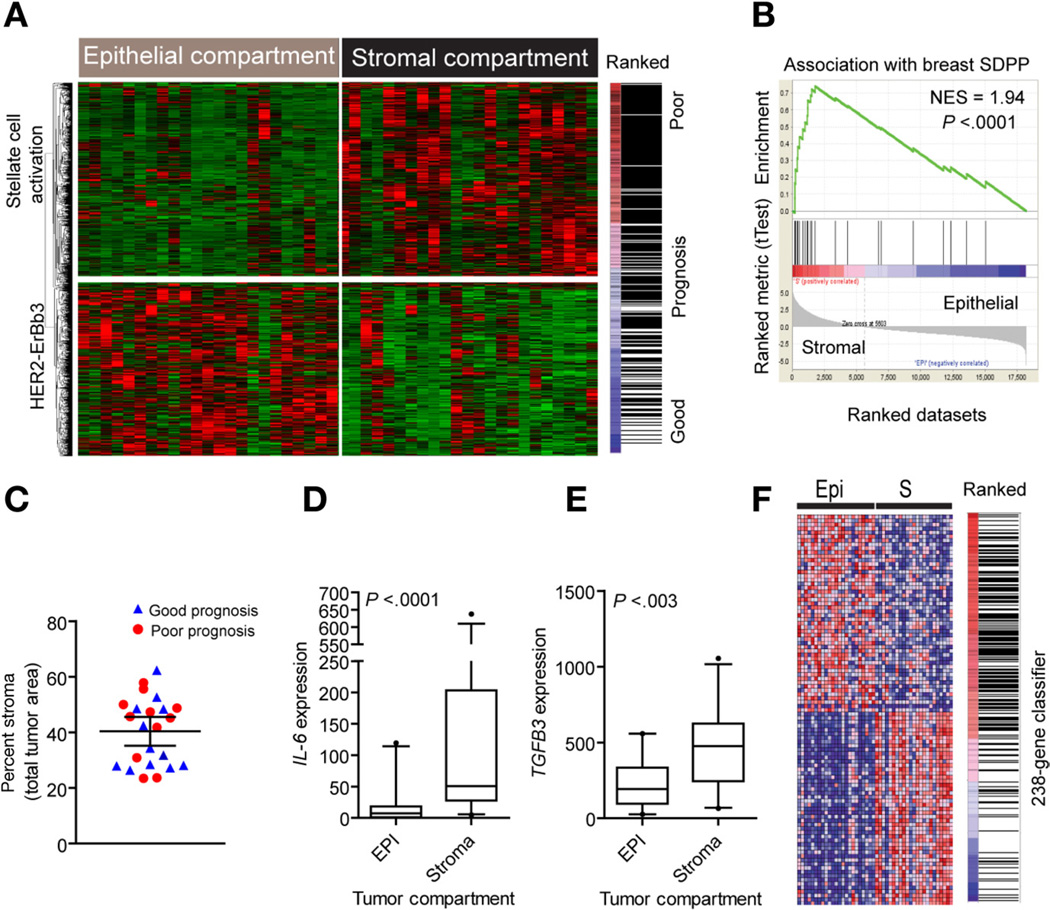
Figure 4.
Analysis of the tumor microenvironment. (A) Unsupervised hierarchical clustering of epithelial and stromal cell compartments. Laser capture microdissection was used to isolate distinct cell populations from 23 tumors and identify gene expression differences. A total of 1442 genes were identified as differentially expressed between tumor epithelium and stroma by means of a paired bootstrap t test (P < .001). The stromal gene signature is enriched and associated with the group of patients with overall poor clinical outcome. (B) GSEA using a curated stromal gene set associated with overall poor prognosis in breast cancer. The 26-gene stromal-derived prognostic predictor (SDPP) was significantly enriched and positively associated with the stromal cell compartment in CCA. (C) Quantification of the epithelial-to-stromal composition given as a percent stromal area. The prognostic classification is given as good (blue) and poor (red) survival classes. (D and E) Analysis of (D) IL-6 and (E) TGFB3 gene expression in the tumor epithelial and stromal compartments (n = 23), respectively. Statistical significance was determined by Mann–Whitney test (2 tailed). The box plots show the mean, and whiskers are given for the 5th to 95th percentiles. (F) Association of the 238-gene classifier with the epithelial cell compartment. Hierarchical clustering of the top 50 ranked genes shows the enrichment and positive association with the tumor epithelium.

