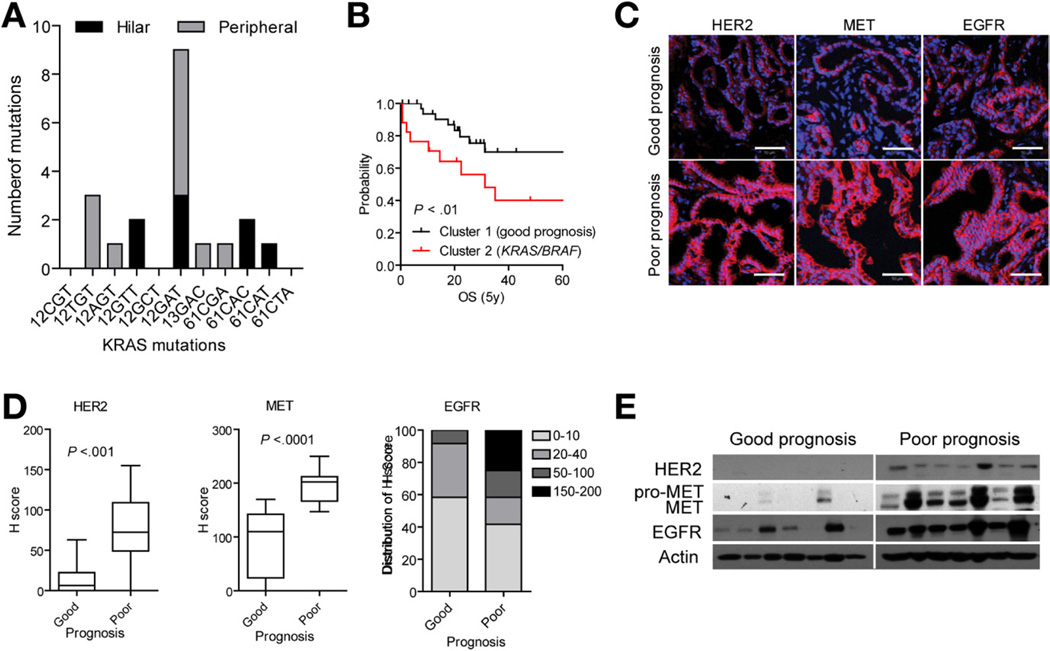
Figure 5.
Characterization of the CCA classification. (A) Frequency of the KRAS mutations in codon 12, 13, and 61 detected by real-time quantitative polymerase chain reaction. The number of mutations is grouped according to hilar (black) and peripheral (gray) tumor subtype. (B) Survival analysis. The mutational status of KRAS/BRAF was significantly associated with poor prognosis as represented by Kaplan–Meier plots and log-rank statistics. (C) Immunohistochemical analysis of HER2, MET, and EGFR protein. Representative images are shown. Scale bar = 50 µm. (D) Semiquantitative assessment of immunohistochemical staining by H-score for HER2, MET, and EGFR. The box plots show the mean H-scores in good and poor prognosis tumor groups (n = 12 each), and whiskers are given for 5th to 95th percentiles. (E) Western blot analysis of HER2, MET, and EGFR expression in 7 patients from each of the prognostic subclasses. Actin was used as loading control.

