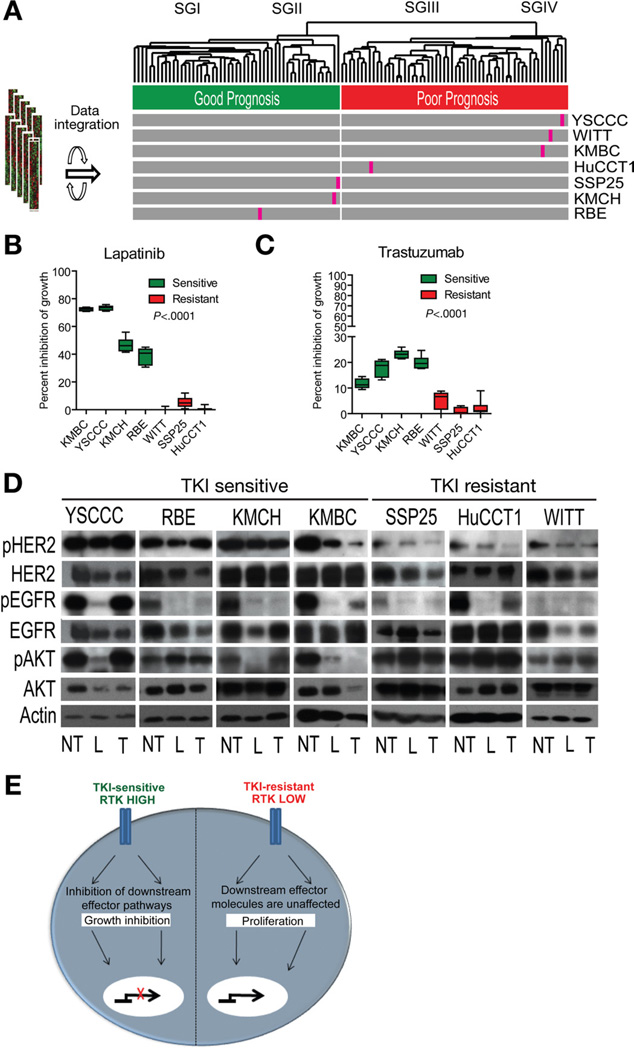
Figure 6.
Effect of TKIs in CCA. (A) Integration of 7 human CCA cell lines with the patient cohort using the 238-gene classifier. (B and C) Effect of a 7-day treatment with (B) lapatinib and (C) trastuzumab on the viability of CCA cell lines using an estimated 50% lethal dose for lapatinib or 500 µg/mL trastuzumab, respectively, for each cell line. Bars represent 8 experiments as mean ± 95% CI viability expressed as percent versus corresponding controls. The statistical significance was determined by one-way analysis of variance with Tukey’s multiple comparison tests (α = .05). (D) Western blot analysis of drug-target EGFR, HER2, and downstream AKT following treatment with lapatinib (L), trastuzumab (T), and untreated control (NT), respectively. (E) Schematic representation of TKI response. TKI-sensitive CCA cell lines have high level and activity of EGFR and HER2 expression. Downstream AKT signaling is unaffected in TKI-resistant CCA cell lines.

