Fig. 3.
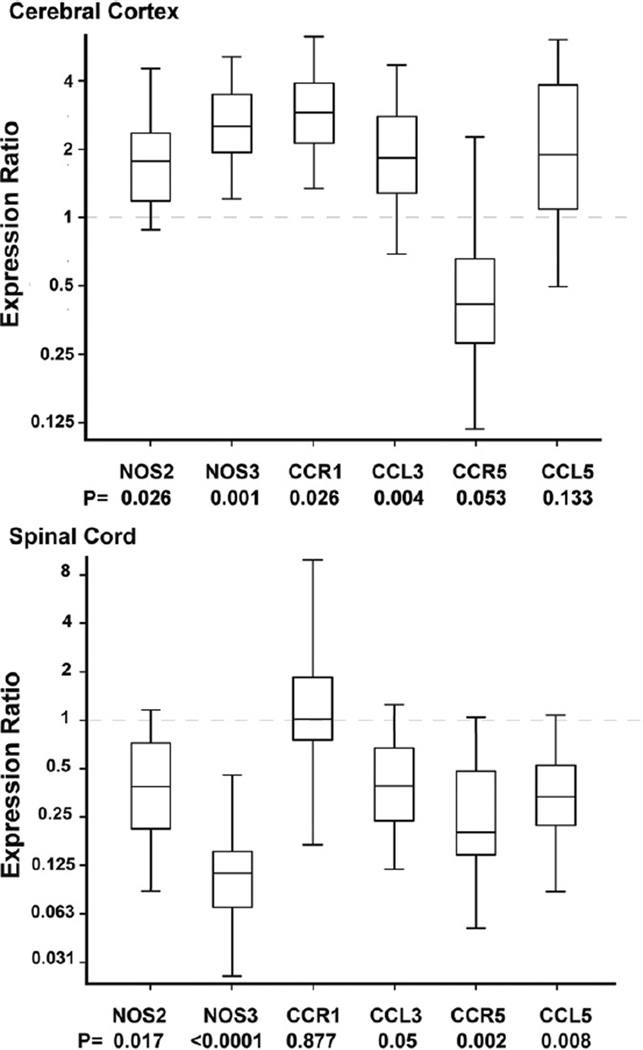
Effect of NOS1 deficiency on NOS2, NOS3, and chemokines gene expression in cerebral cortex and spinal cord. The box plots represent the 25th to 75th interquartile expression ratio (the middle 50% of observations) and the line in the box, the median gene expression ratio comparing NOS1 deficient vs. wild-type animals used as calibrators (expression of 1). Whiskers represent minimum and maximum observations. Numbers below each listed gene represent the p value of expression ratio comparing NOS1-KO vs. wild-type animals. In cerebral cortex, NOS1 deficient animals have significant upregulation of NOS2, NOS3, C–C chemokine receptor type 1 (CCR1), C–C chemokine ligand 3 (CCL3) but similar expressions of C–C chemokine receptor 5 (CCR5) and C–C chemokine ligand 5 (CCL5) compared with wild-type controls. In contrast in spinal cord, NOS1 deficient animals have significant downregulation of NOS2, NOS3, CCL3, CCR5, and CCL5 but similar expression of CCR1 compared with wild-type controls. N = 5 animals per group.

