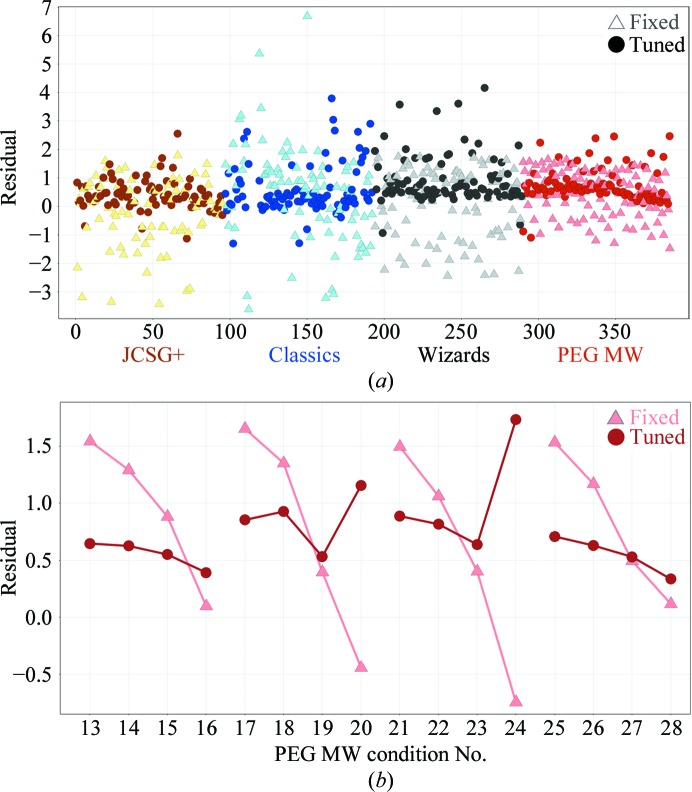
Figure 3.
Plots of the residual error in measured volume delivered relative to a 5 nl target for experiments at fixed energy throughout (light triangles) versus individually adjusted energies (dark circles). (a) Distribution of residuals across four screens (color-coded). (b) Enlarged view of conditions 13–28 of the PEG MW grid. Each set of four linked points is a progression of PEG concentration (5, 15, 20, 25%), illustrating the nature of the effect of the diminished measured volumes delivered as PEG increases (triangles). Application of a coarse energy correction (circles) demonstrates better delivery profiles (smaller range in residuals across PEG concentrations) and highlights further improvements to our energy-correction calculations to reduce overcompensation of the lowest measured residuals (e.g. points 20 and 24).

