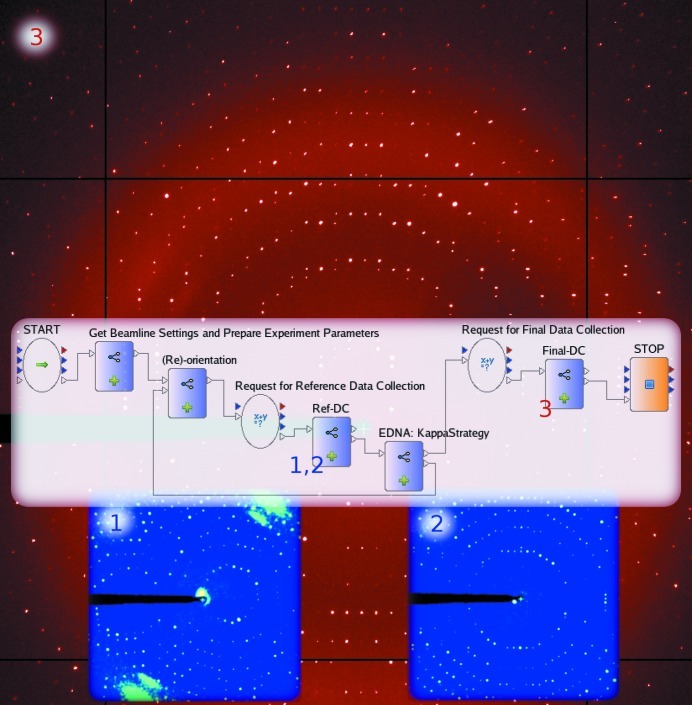
Figure 6.
The kappa-reorientation workflow with example diffraction images captured from the same FAE crystal in different orientations. The blue image on the left is taken at step 1 in the initial random orientation. The blue image on the right is the reference image at step 2 in an aligned orientation to optimize the strategy for a complete data collection in this orientation. The red background image is taken at step 3 as the first image of the final data set.

