Fig. 5.
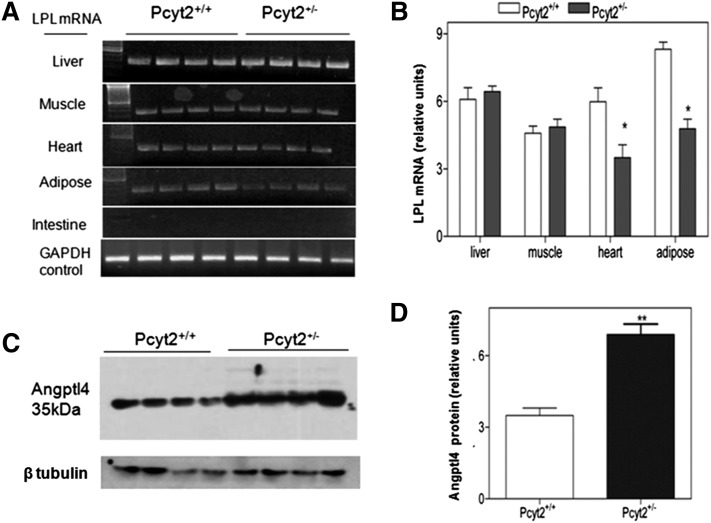
Pcyt2+/− mice have reduced tissue LPL and increased plasma Angptl4. A: PCR results for LPL mRNA expression in various tissues of Pcyt2+/− and littermate control mice (n = 4). B: LPL mRNA levels relative to control G3PDH showing significantly reduced LPL expression in homogenates of Pcyt2+/− heart (1.5-fold, P < 0.002) and adipose (1.74-fold, P < 0.0006) and no change in skeletal muscle and liver total homogenates. Immunoblots (C) and densitometric analysis (D) showing increased amounts of Angptl4 protein in Pcyt2+/− plasma relative to control plasma (1.97-fold, P < 0.0007, n = 4).

