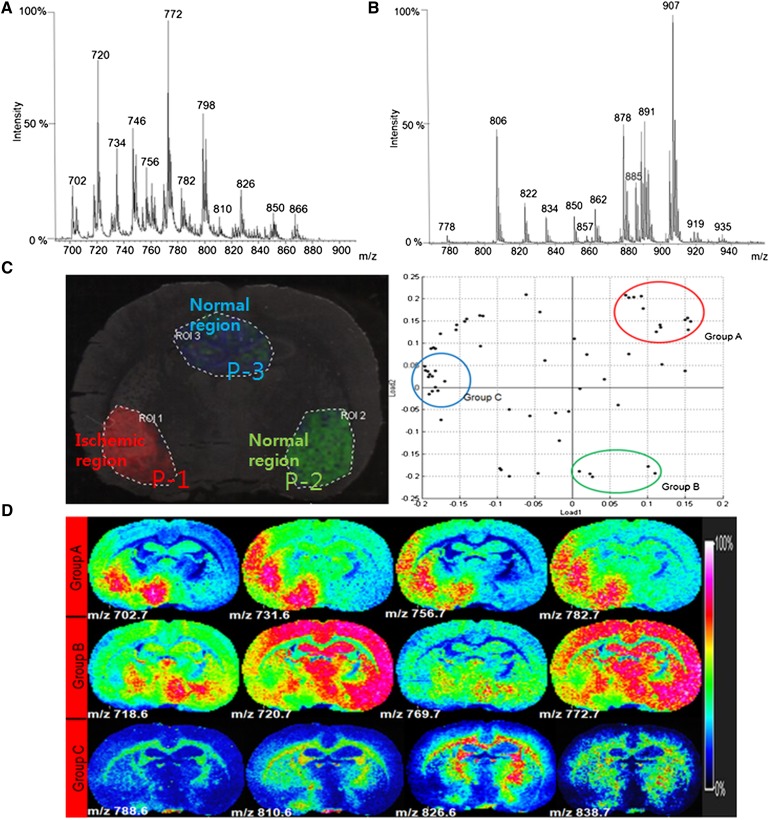
Fig. 3.
Total MS spectrum analysis and statistical analysis by PCA. A: Total MS spectrum in positive ionization mode. B: Total MS spectrum in negative ionization mode. C: PCA and classification analysis of the IMS data in positive-ionization mode. D: Representative images corresponding to the PCA result.

