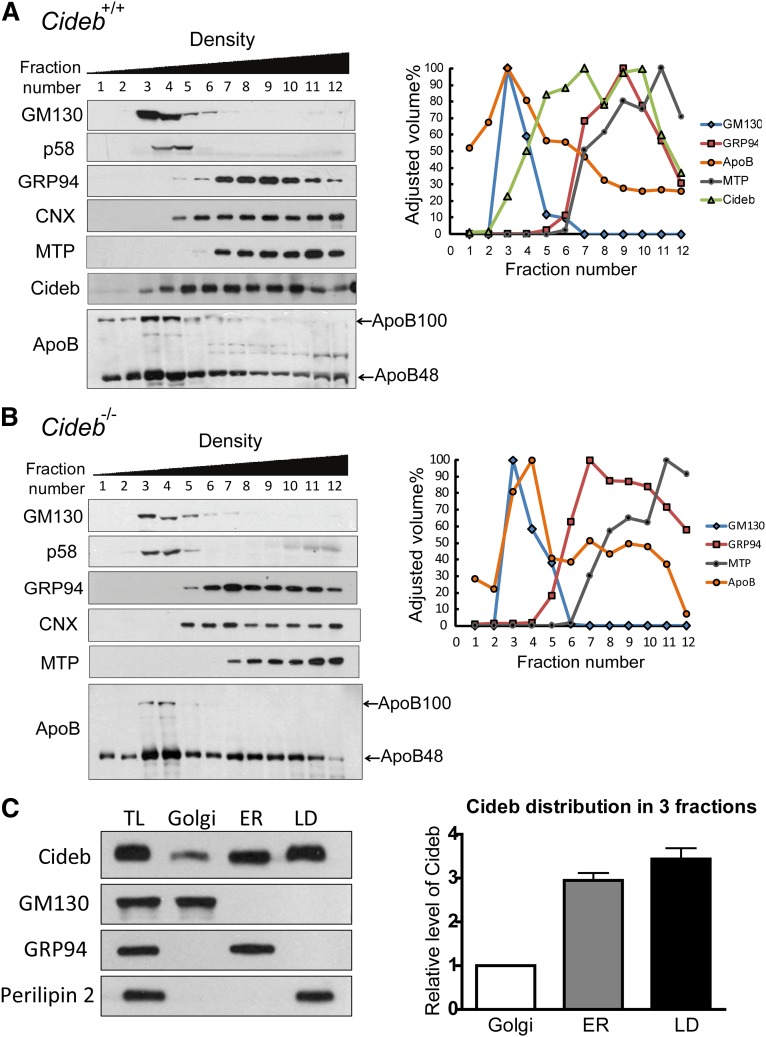
Fig. 1.
Distribution patterns of Cideb, perilipin 2, ApoB, and marker proteins in the Golgi and ER fractions. (A, B) Biochemical fractionation of liver microsomes was performed by sucrose density gradient ultracentrifugation using wild-type (+/+) (A) and Cideb−/− (–/–) (B) mice. The presence of specific proteins in each fraction was determined by Western blot analysis with various antibodies (left panels). GM130 and p58 represent Golgi markers. GRP94, CNX, and MTP are ER-specific markers. The intensities of the positive bands on the immunoblots were determined semiquantitatively using Bio-Rad Quantity One software and plotted as the percentage of the maximum value, in which 100% corresponds to the highest value (right panels). (C) Comparison of the relative levels of Cideb in the Golgi, ER, and LD compartments. The Golgi, ER, and LD fractions were collected after further ultracentrifugation and normalized to 600 μl. Three microliters of each fraction was loaded for immunoblot analysis (left panel). GM130, a Golgi marker; GRP94, an ER marker; perilipin 2, a LD marker. The intensities of the Cideb bands on the immunoblots were determined semiquantitatively using Bio-Rad Quantity One software, and the abundances of Cideb in the ER and LDs were compared with that in the Golgi (right panel). The experiment was repeated three times.

