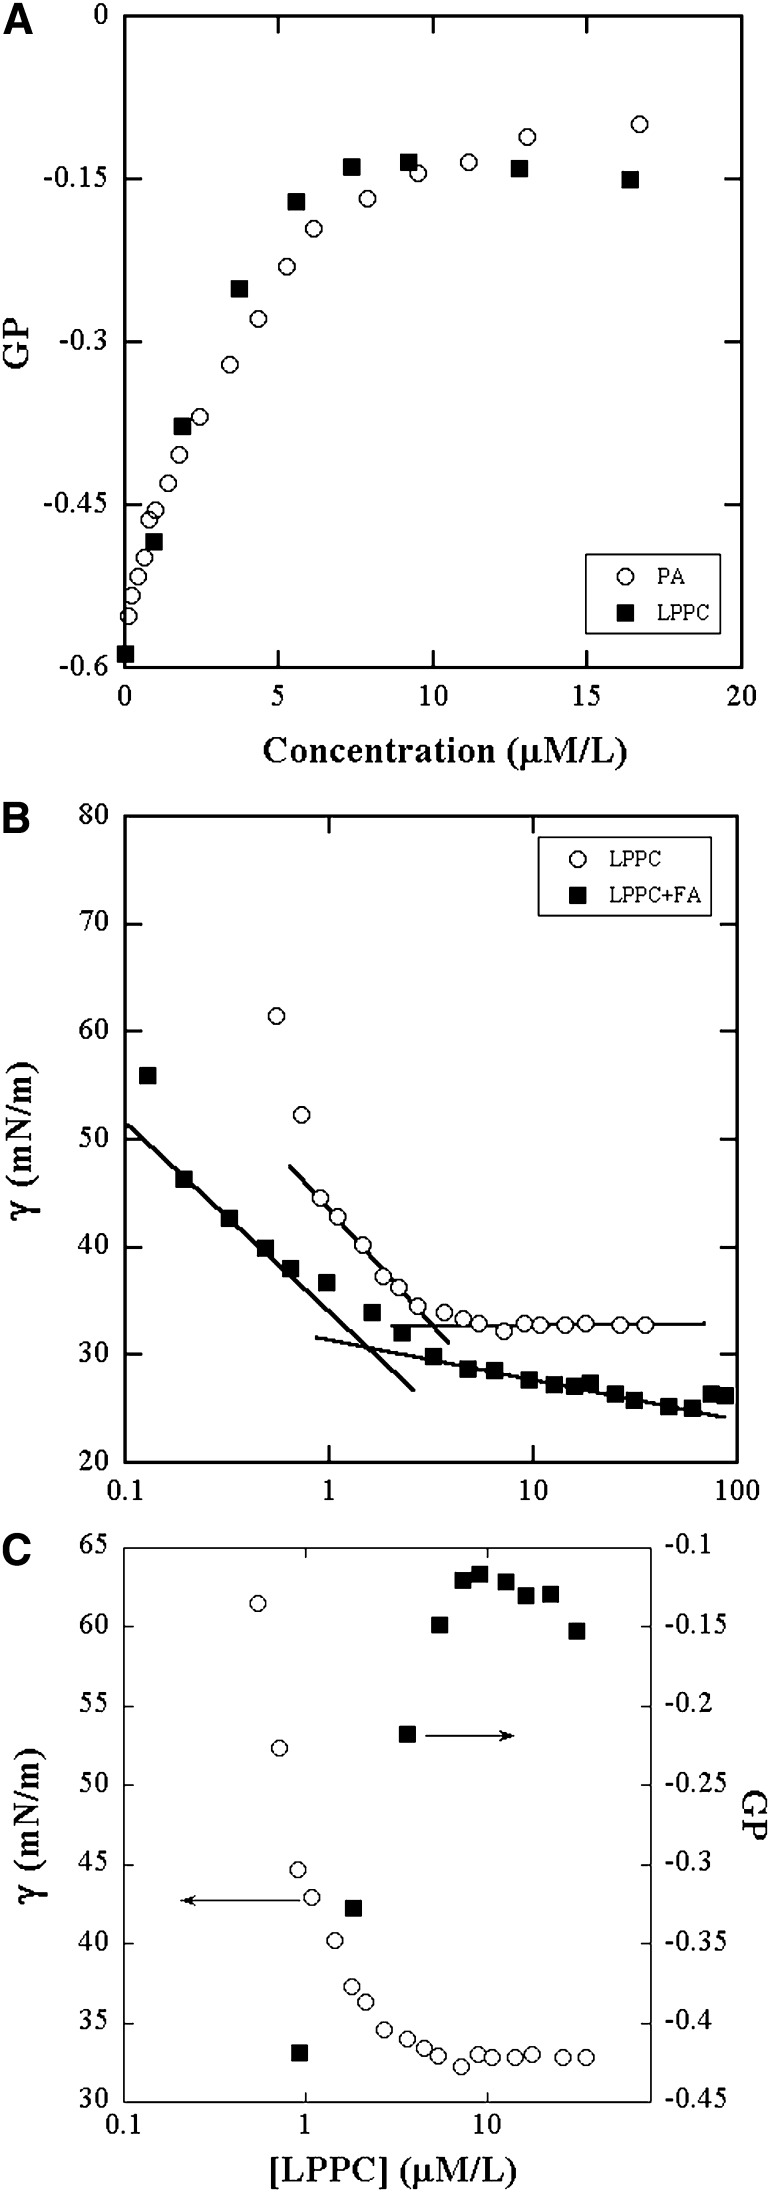
Fig. 2.
A:Variation of GP of ADIFAB fluorescence in Hepes buffer with concentration of LPPC (■) and PA (○). The flattening of the curve in LPPC solutions is due to micelle formation. B: cmc determination of LPPC (○) and 1.7:1 of LPPC:PA (■) by surface tension (γ) measurements. The surface tension decreases with concentration and cmc is the concentration at the intersection of the two lines shown. C: Comparison of GP (■) and surface tension (○) to show their similarities in behavior and the effect of micelle formation on GP.

