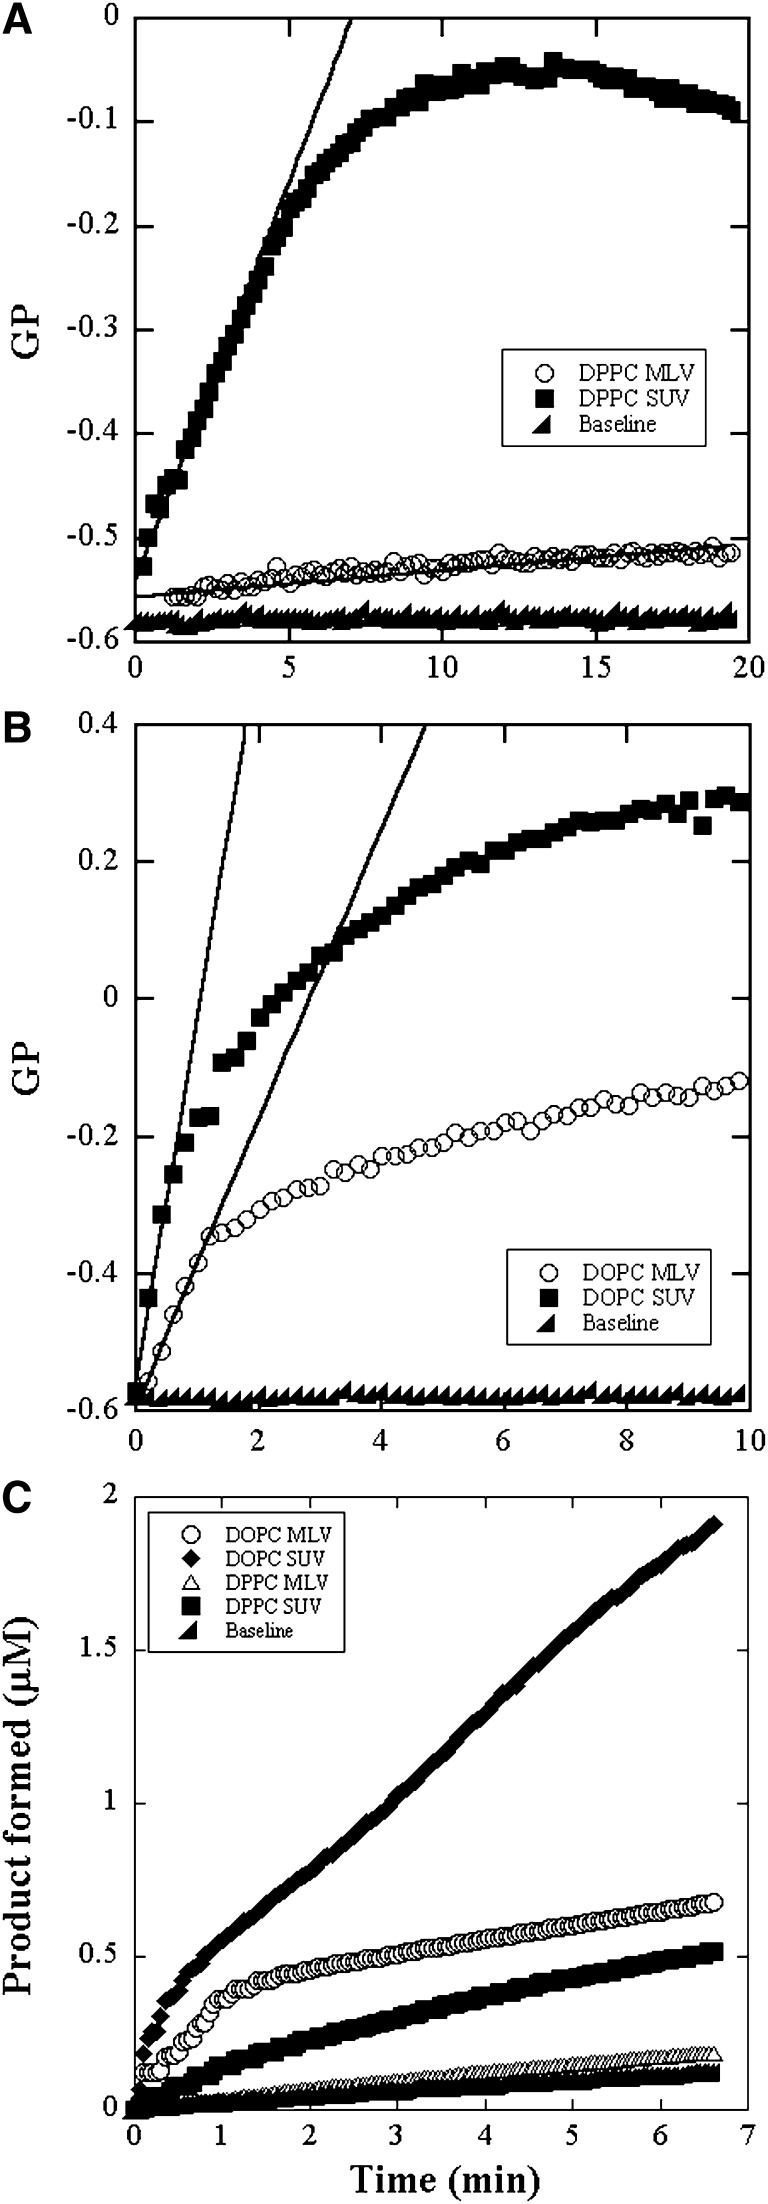
Fig. 5.
Reaction progress curves of bee venom PLA2 catalyzed hydrolysis of 100 μM DPPC and DOPC bilayers. GP of ADIFAB fluorescence in SUV and MLV of (A) DPPC and (B) DOPC. Two microliters of enzyme solution at a concentration of 0.04 mg/ml was added to the sample solution of volume 2 ml. The solid lines are linear fits to the initial linear region. The slopes of these lines yield the initial rate of hydrolysis. C: product formed measured by pH-Stat in the DPPC and DOPC bilayers. Three microliters of enzyme solution at a concentration of 0.8 mg/ml was added to the sample solution of volume 5 ml.

