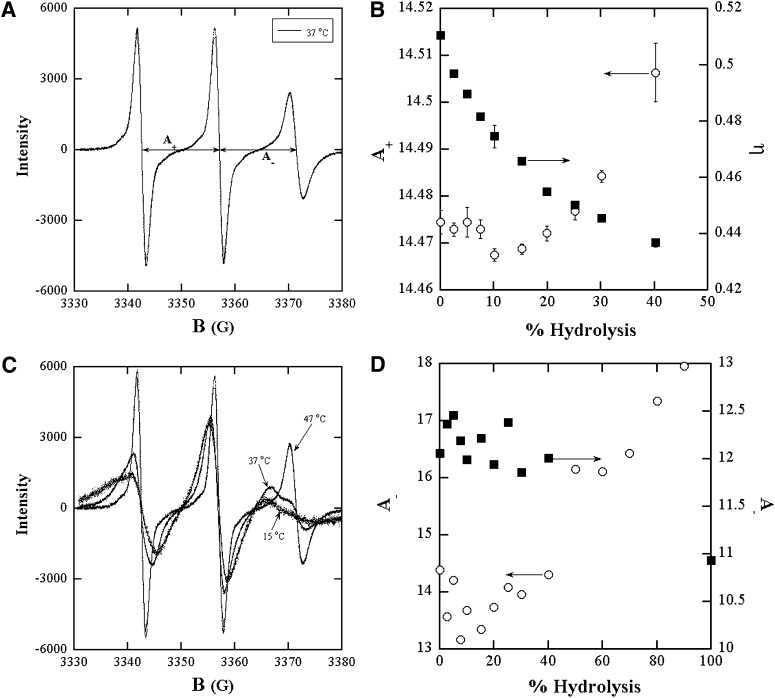
Fig. 6.
ESR spectra of 16 DSE in lipid bilayer dispersions of hydrolysis products in (A) LOPC (2.5 mM)+OA(2.5 mM)+DOPC(22.5 mM) MLV bilayers at 37°C; (C) LPPC (2.5 mM)+PA(2.5 mM)+DPPC(22.5 mM) MLV at 15°C, 37°C, 47°C. B: Hyperfine splitting constant A+ and microviscosity in DOPC +LOPC+OA and (D) Hyperfine splitting constants A_ of the gel (○) and liquid (■) phases in DPPC +LPPC+PA derived from spectral fitting as a function of the percent level of either of the hydrolysis products. Each of the compositions represents states of the bilayer during the progress of the hydrolysis reaction.

