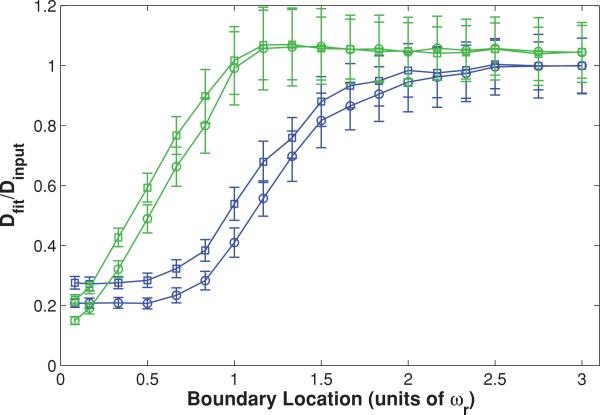
FIG. 6.
(Color) Two parallel plane boundaries parallel to the optical axis at a range of positions, presented as fractions of ωr from the focal volume center for a high NA (squares) lens and a low NA (circles) lens. Fluorescence recovery curves were generated via Monte Carlo simulation and fit to the standard MP-FRAP model (blue) and the new MP-FRAP model (green) designed for use between two parallel plane barriers. Fit diffusion coefficients were normalized to the input diffusion coefficient.

