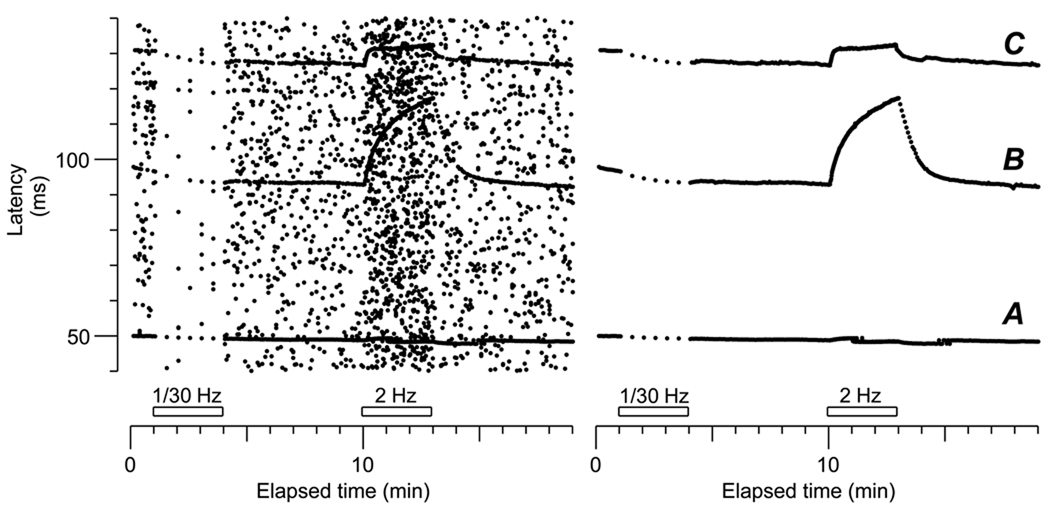
Figure 1.
Recording from the right superficial peroneal nerve. Every dot displayed in the raster on the left represents one of the highest 60 peaks in every 850 ms sweep. Dots that maintain a stable latency in consecutive sweeps are single action potentials of a given fibre. The raster on the right has been cleaned from all the random noise leaving only stable responses. Three fibres are recognized by their stable latency, all conducting below 2 m.s−1 (conduction distance 90 mm). A corresponds to a fibre conducting at 1.8 m.s−1. This fibre displays a minor slowing during repetitive stimulation at 2 Hz, of 1.3%, thus classified as a type 3 (see Serra et al., 1999). B represents a fibre conducting at 0.96 m.s−1 and has the typical slowing profile of a polymodal nociceptor (27%). In C another unit with an initial fast slowing reaching a plateau, with a total slowing during the 3 min 2 Hz tetanus of 4.5% (conduction velocity 0.71 m.s−1). This profile corresponds to our type 4 (Campero et al., 2004), a sympathetic efferent, slightly different form type 2, not found in the current patient.

