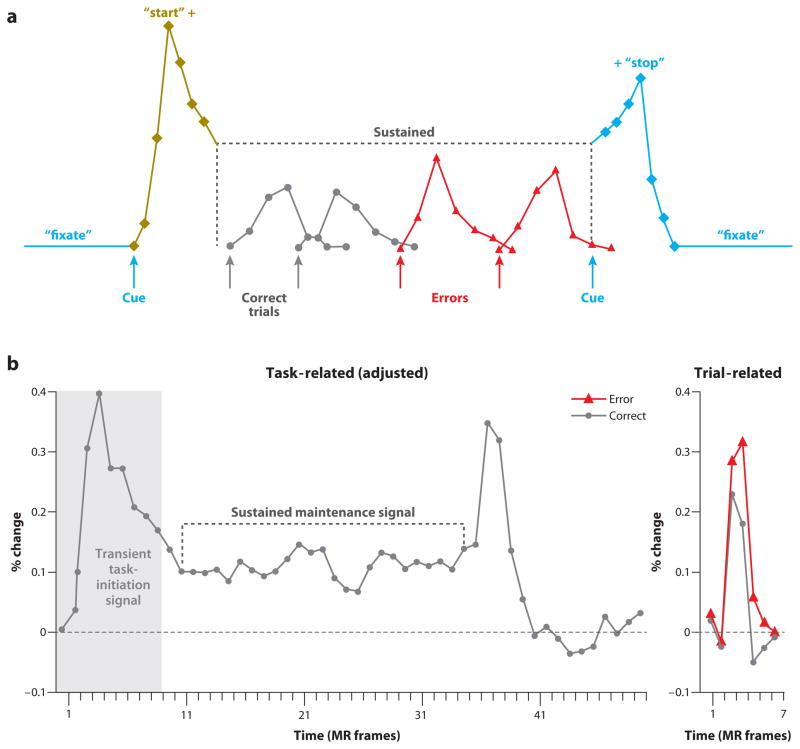
Figure 3.
Executive control signals. The top panel shows three putative executive control signals: a task initiation signal in yellow, a task-maintenance signal in red, and activity related to correct (black) and error (blue) trials (adapted from Dosenbach et al. 2006). Regions showing differences in error versus correct trials are considered to be computing or receiving performance feedback. The bottom figure shows activity in the left anterior insula during a task that contains all the putative signals (plus a transient transition signal at the end of the block of trials). MR, magnetic resonance.

