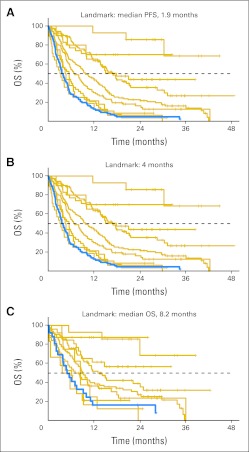
Fig 5.
Kaplan-Meier analysis of overall survival (OS) for patients with new lesions on first restaging using the landmark analysis. Gold curves represent patients with measurable lesions and are identical to the curves in Figs 1A, 1C, and 1E. Blue curves represent survival rates for patients with best response of new lesion(s). For patients with new lesions, (A) OS, 3.9; n = 93; (B) OS, 3.2 months; n = 64; (C) OS, 4.9 months; n = 26. PFS, progression-free survival.

